QC: Aligned Data
12 July, 2023
library(tidyverse)
library(glue)
library(yaml)
library(here)
library(reactable)
library(pander)
library(ngsReports)
library(scales)
library(htmltools)
myTheme <- theme(
    plot.title = element_text(hjust = 0.5),
    text = element_text(size = 13)
  )
## This manages a bug which exists in Bioc 3.16 but is fixed in ngsReports 2.2.3
.parseLogs <- function(data, which = 1){
  {
    if (is.character(which))
        which <- match.arg(which, c("metrics", "histogram", "all"))
    if (is.numeric(which))
        stopifnot(which %in% c(1, 2))
    metrics <- lapply(data, function(x) {
        cmd <- stringr::str_subset(x, "(INPUT|input)")
        ip <- stringr::str_replace_all(cmd, ".+(input|INPUT)([ =]*)([^ ]+.bam).+",
            "\\3")
        ip <- str_replace_all(ip, "[\\[\\]]", "")
        metHeader <- grep("METRICS CLASS\t.+.DuplicationMetrics",
            x)
        df <- ngsReports:::.splitByTab(x[seq(metHeader + 1, by = 1, length.out = 2)])
        df$LIBRARY <- ip
        df
    })
    metrics <- dplyr::bind_rows(metrics)
    metrics$PERCENT_DUPLICATION <- as.numeric(metrics$PERCENT_DUPLICATION)
    intCols <- setdiff(colnames(metrics), c("LIBRARY", "PERCENT_DUPLICATION"))
    metrics[intCols] <- lapply(metrics[intCols], as.integer)
    metrics <- as_tibble(metrics)
    histData <- lapply(data, function(x) {
        cmd <- stringr::str_subset(x, "(INPUT|input)")
        ip <- stringr::str_replace_all(cmd, ".+(input|INPUT)([ =]*)([^ ]+.bam).+",
            "\\3")
        ip <- str_replace_all(ip, "[\\[\\]]", "")
        histHeader <- grep("HISTOGRAM\tjava.lang.Double", x)
        df <- NULL
        if (length(histHeader)) {
            x <- x[-seq_len(histHeader)]
            x <- x[!grepl("^$", x)]
            df <- ngsReports:::.splitByTab(x)
            df$LIBRARY <- ip
            df <- dplyr::select(df, "LIBRARY", everything())
        }
        df
    })
    histData <- dplyr::bind_rows(histData)
    if (ncol(histData)) {
        histData <- lapply(histData, function(x) {
            any_na <- any(is.na(suppressWarnings(as.numeric(x))))
            if (!any_na)
                x <- as.numeric(x)
            x
        })
        histData$BIN <- as.integer(histData$BIN)
        histData <- as_tibble(histData)
    }
    out <- list(metrics = metrics, histogram = histData)
    out <- lapply(out, function(x) {
        colnames(x) <- stringr::str_replace_all(colnames(x),
            "_", " ")
        colnames(x) <- stringr::str_to_title(colnames(x))
        x
    })
    if (which != "all")
        out <- out[[which]]
    out
  }
}
config <- read_yaml(here::here("config/config.yml"))
samples <- read_tsv(here::here(config$samples)) %>%
bind_rows(
tibble(
accession = unique(.$input), target = "Input"
)
)
bwt2_logs <- here::here("output", "bowtie2", glue("{samples$accession}.log")) %>%
setNames(samples$accession) %>%
.[file.exists(.)] %>%
importNgsLogs()
duplogs <- here::here("output", "markDuplicates", glue("{samples$accession}.metrics.txt")) %>%
setNames(samples$accession) %>%
.[file.exists(.)] %>%
sapply(readLines, simplify = FALSE) %>%
.parseLogs() %>%
mutate(
Filename = gsub(".bam$", "", basename(Library))
) %>%
dplyr::select(Filename, everything())
qc_path <- here::here(config$paths$qc, "raw")
fl <- file.path(qc_path, glue("{samples$accession}_fastqc.zip")) %>%
setNames(samples$accession)
rawFqc <- FastqcDataList(fl[file.exists(fl)])
names(rawFqc) <- names(fl)[file.exists(fl)]
samples <- readTotals(rawFqc) %>%
mutate(accession = str_remove_all(Filename, ".fastq.gz")) %>%
dplyr::select(accession, Total_Sequences) %>%
right_join(samples, by = "accession")Introduction
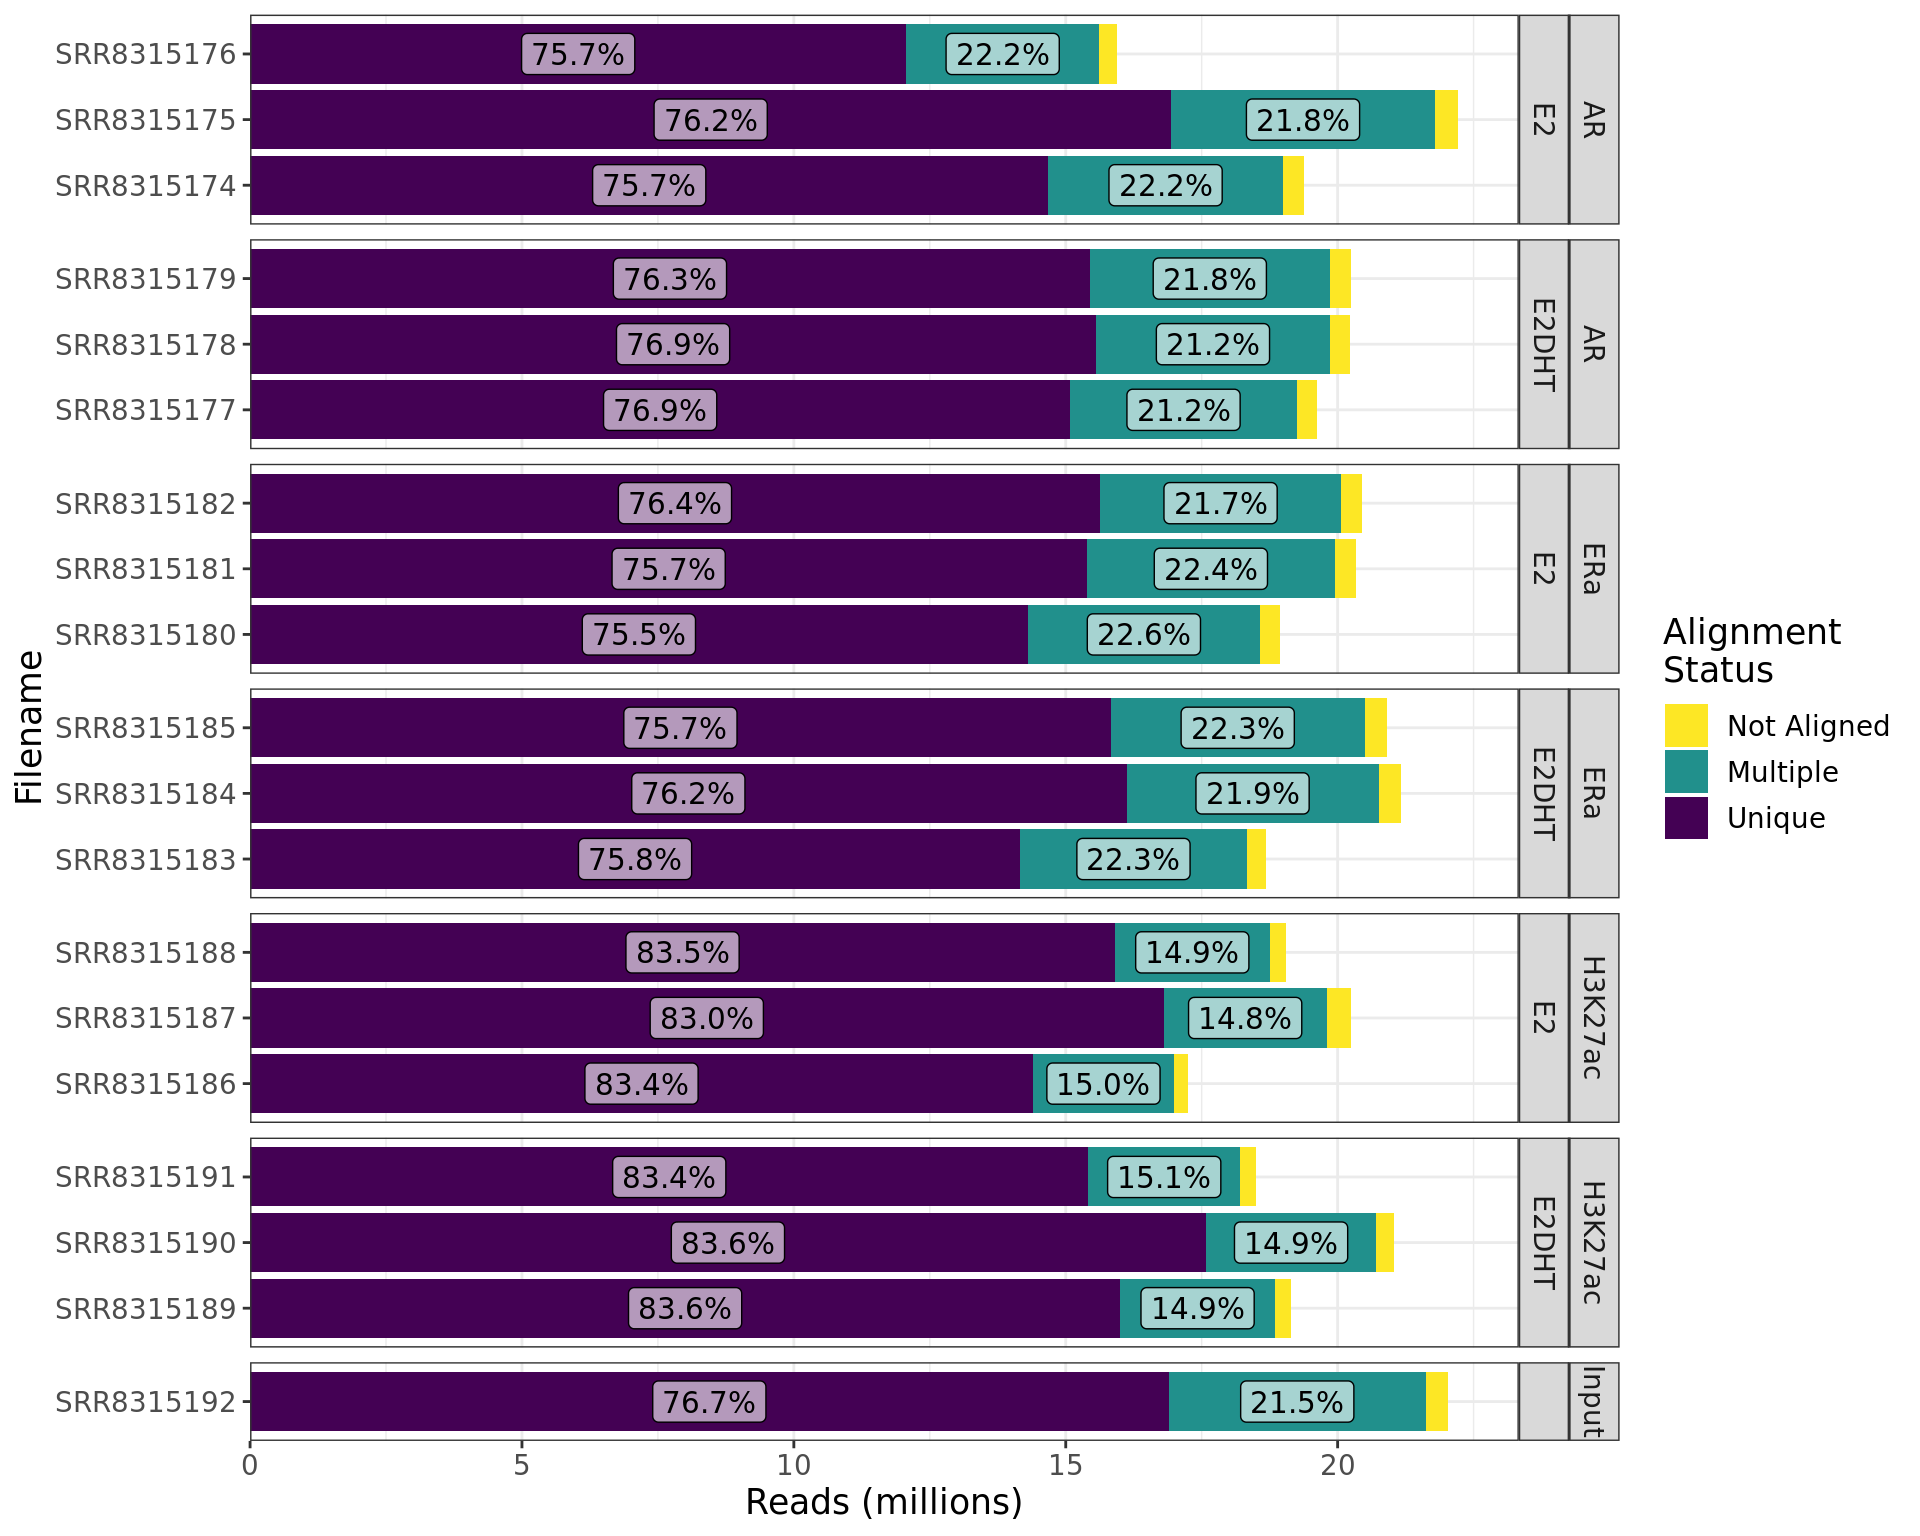
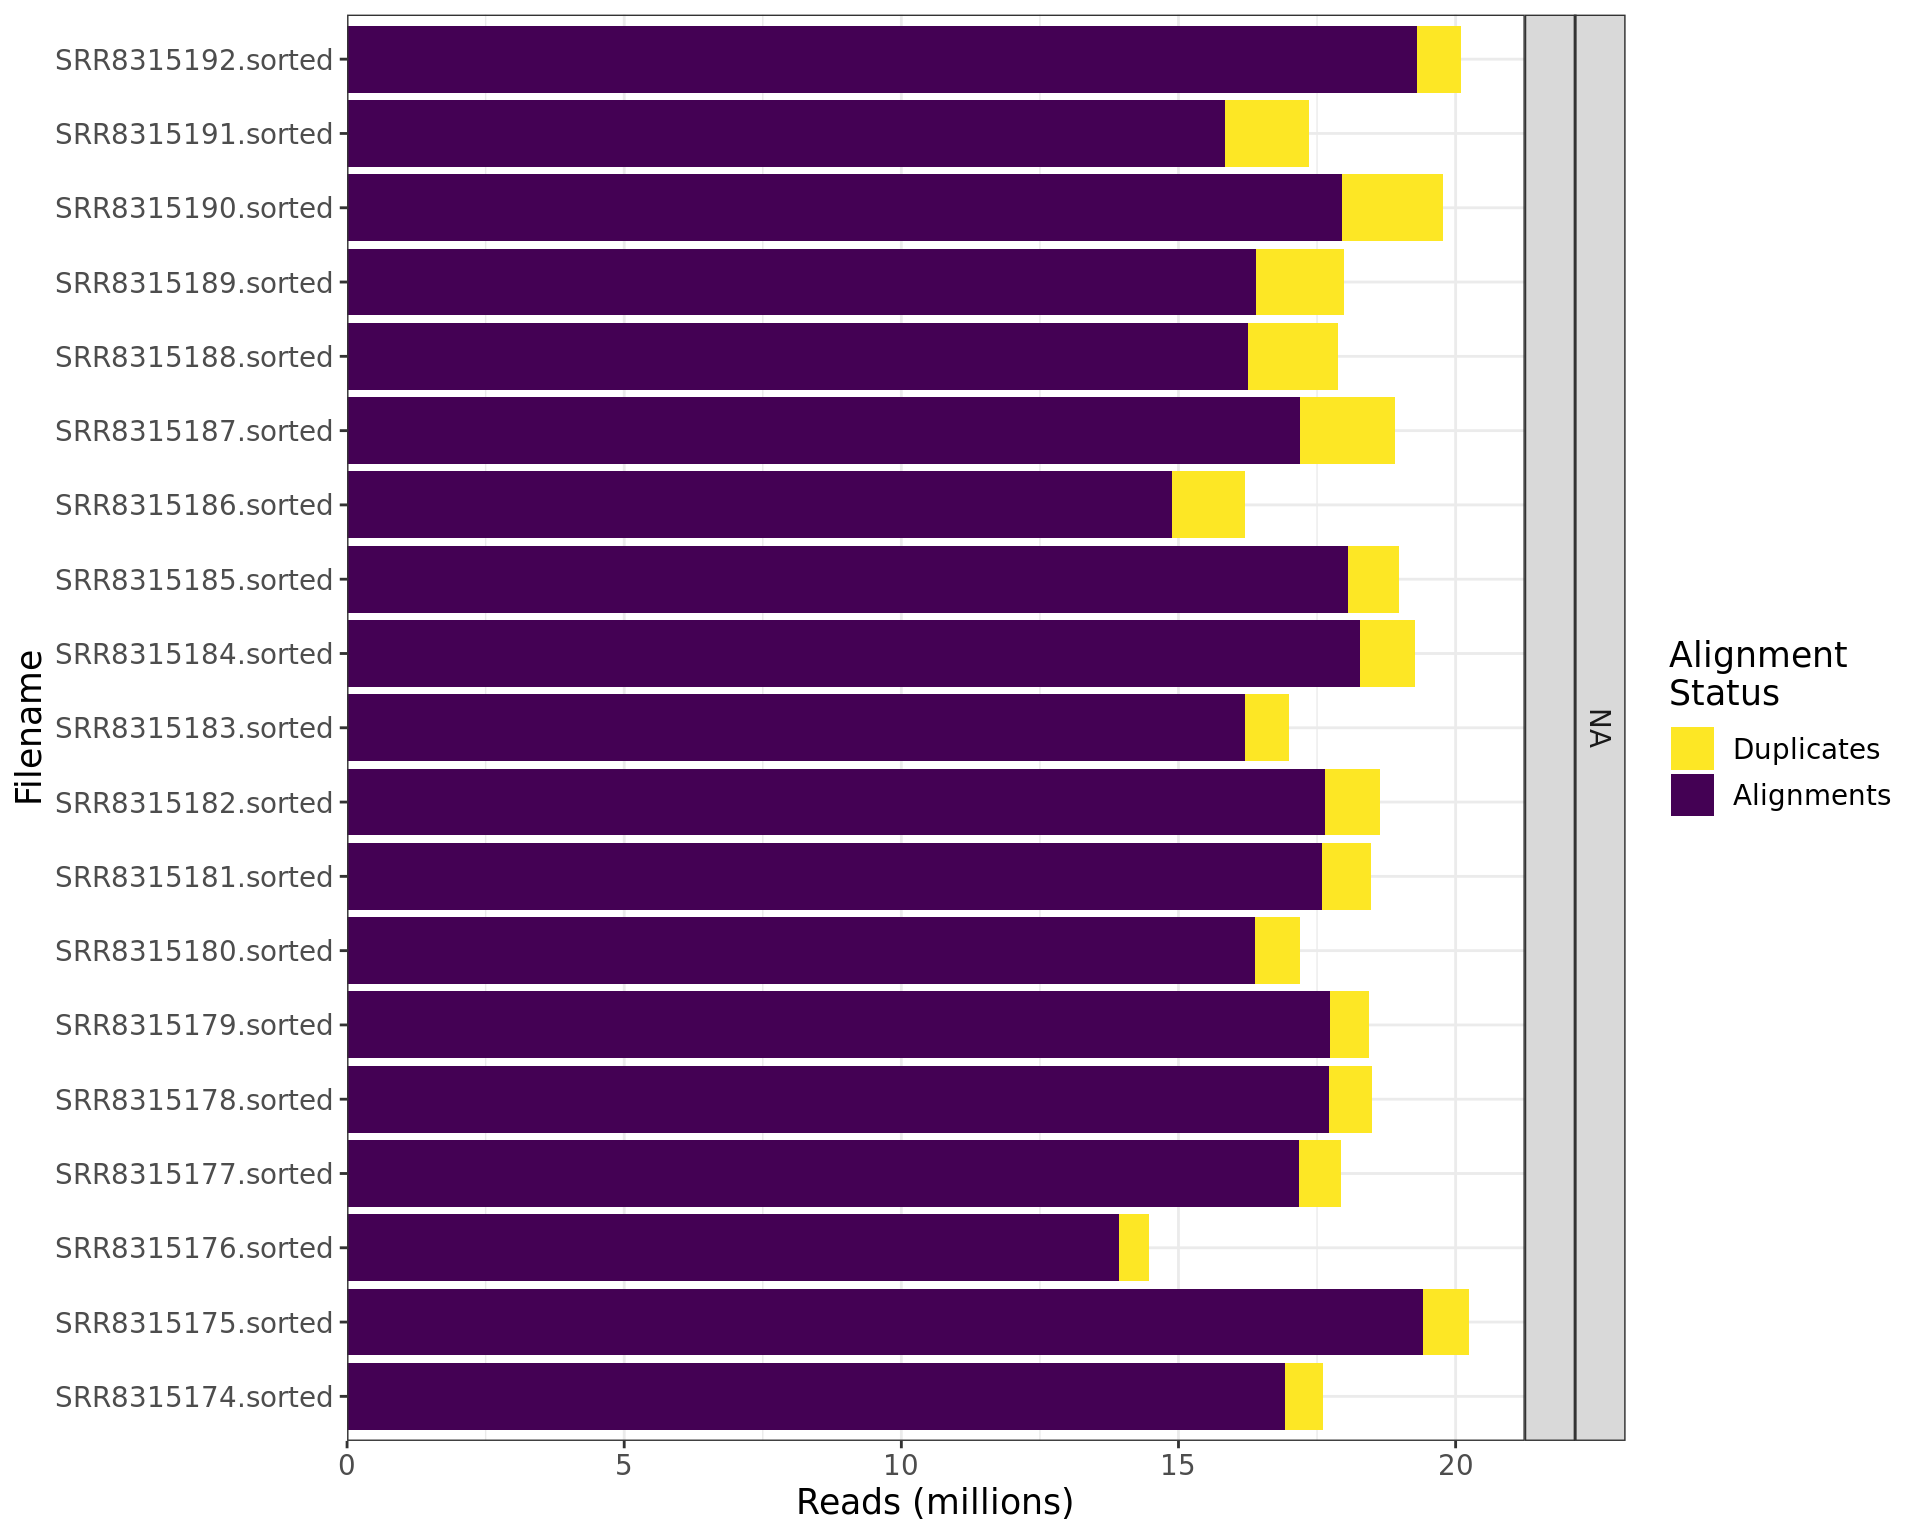
This final QC worksheet summarises the alignments and de-duplication
metrics. Single-end alignments were performed using bowtie2
(Langmead and Salzberg 2012) before being
de-duplicated using markDuplicates from the Picard suite of
tools (https://broadinstitute.github.io/picard)
Alignment Rates
bwt2_logs %>%
  mutate(Filename = str_remove_all(Filename, ".log")) %>%
  dplyr::select(Filename, Unique_Unpaired, Multiple_Unpaired, Not_Aligned) %>%
  pivot_longer(cols = contains("_"), names_to = "Status", values_to = "Reads") %>%
  left_join(samples, by = c("Filename" = "accession")) %>%
  mutate(
    Status = Status %>%
      str_remove_all("_Unpaired") %>%
      str_replace_all("_", " ") %>%
      factor() %>%
      relevel(ref = "Unique"),
    treatment = str_replace_na(treatment, "")
  ) %>%
  arrange(Status) %>%
  mutate(cumsum = cumsum(Reads), p = Reads / sum(Reads), .by = "Filename") %>%
  mutate(y = cumsum - 0.5 * Reads) %>%
  ggplot(aes(Filename, Reads, fill = fct_rev(Status))) +
  geom_col() +
  geom_label(
    aes(Filename, y, label = percent(p, 0.1)),
    data = . %>% dplyr::filter(p > 0.05),
    fill = "white", alpha = 0.6, show.legend = FALSE
  ) +
  facet_grid(target + treatment ~ ., scales = "free", space = "free") +
  scale_y_continuous(
    labels = comma_format(scale = 1e-6), expand = expansion(c(0, 0.05))
  ) +
  scale_fill_viridis_d(direction = -1) +
  labs(y = "Reads (millions)", fill = "Alignment\nStatus") +
  theme_bw() +
  myTheme +
  coord_flip()
DeDuplication Summary
duplogs %>%
    dplyr::select(
      Filename, Alignments = `Unpaired Reads Examined` ,
      Duplicates = `Unpaired Read Duplicates`, `Percent Duplication`
    ) %>%
    left_join(samples, by = c("Filename" = "accession")) %>%
    dplyr::select(-input) %>%
    mutate(
      Alignments = Alignments - Duplicates,
      Discarded = Total_Sequences - Alignments - Duplicates
    ) %>%
    dplyr::select(
      Filename, Total_Sequences, Alignments, Discarded, Duplicates, everything()
    ) %>%
  pivot_longer(
    cols = all_of(c("Alignments", "Discarded", "Duplicates")),
    names_to = "Status", values_to = "Reads"
  ) %>%
  mutate(
    Status = factor(Status, levels = c("Discarded", "Duplicates", "Alignments")),
    treatment = str_replace_na(treatment, "")
  ) %>%
  arrange(Filename, desc(Status)) %>%
  mutate(
    p = Reads / sum(Reads),
    y = cumsum(Reads) - 0.5 * Reads,
    .by = Filename
  ) %>%
  ggplot(aes(Filename, Reads, fill = Status )) +
  geom_col() +
  geom_label(
    aes(Filename, y, label = percent(p, 0.1)),
    data = . %>% dplyr::filter(p > 0.033),
    fill = "white", alpha = 0.7, size = 3.5
  ) +
  facet_grid(target + treatment ~ ., scales = "free", space = "free") +
  scale_y_continuous(
    labels = comma_format(scale = 1e-6), expand = expansion(c(0, 0.05))
  ) +
  scale_fill_viridis_d(direction = -1) +
  labs(y = "Reads (millions)", fill = "Alignment\nStatus") +
  theme_bw() +
  myTheme +
  coord_flip()
Summary of the final alignments after trimming, filtering and deduplicating. Percentages are shown only if greater than 3.3% to avoid overlapping labels
Summary Table
div(
  class = "table",
  div(
    class = "table-header",
    htmltools::tags$caption(
      htmltools::em(
        "Alignment and de-duplication summary, with the number of reads in the
        initial fastq files compared to the total number of retained alignments
        after de-duplication."
      )
    )
  ),
  duplogs %>%
    dplyr::select(
      Filename, Alignments = `Unpaired Reads Examined` ,
      Duplicates = `Unpaired Read Duplicates`, `Percent Duplication`
    ) %>%
    left_join(samples, by = c("Filename" = "accession")) %>%
    dplyr::select(-input) %>%
    mutate(
      Alignments = Alignments - Duplicates,
      `% Retained` = Alignments / Total_Sequences,
      Discarded = Total_Sequences - Alignments - Duplicates
    ) %>%
    dplyr::select(
      Filename, Total_Sequences, Alignments, Discarded, Duplicates, `% Retained`,
      everything()
    ) %>%
    setNames(str_replace_all(names(.), "_", " ")) %>%
    setNames(str_to_title(names(.))) %>%
    reactable(
      sortable = TRUE, filterable = TRUE, resizable = TRUE,
      showPageSizeOptions = TRUE,
      columns = list(
        `Total Sequences` = colDef(
          name = "Raw Reads", format = colFormat(separators = TRUE)
        ),
        Discarded = colDef(format = colFormat(separators = TRUE)),
        Alignments = colDef(format = colFormat(separators = TRUE)),
        `% Retained` = colDef(format = colFormat(percent = TRUE, digits = 2)),
        Duplicates = colDef(format = colFormat(separators = TRUE)),
        `Percent Duplication` = colDef(
          name = "% Duplication",
          format = colFormat(percent = TRUE, digits = 2)
        )
      )
    )
)References
R version 4.2.3 (2023-03-15)
Platform: x86_64-conda-linux-gnu (64-bit)
locale: LC_CTYPE=en_AU.UTF-8, LC_NUMERIC=C, LC_TIME=en_AU.UTF-8, LC_COLLATE=en_AU.UTF-8, LC_MONETARY=en_AU.UTF-8, LC_MESSAGES=en_AU.UTF-8, LC_PAPER=en_AU.UTF-8, LC_NAME=C, LC_ADDRESS=C, LC_TELEPHONE=C, LC_MEASUREMENT=en_AU.UTF-8 and LC_IDENTIFICATION=C
attached base packages: stats, graphics, grDevices, utils, datasets, methods and base
other attached packages: htmltools(v.0.5.5), scales(v.1.2.1), ngsReports(v.2.0.0), patchwork(v.1.1.2), BiocGenerics(v.0.44.0), pander(v.0.6.5), reactable(v.0.4.4), here(v.1.0.1), yaml(v.2.3.7), glue(v.1.6.2), lubridate(v.1.9.2), forcats(v.1.0.0), stringr(v.1.5.0), dplyr(v.1.1.2), purrr(v.1.0.1), readr(v.2.1.4), tidyr(v.1.3.0), tibble(v.3.2.1), ggplot2(v.3.4.2) and tidyverse(v.2.0.0)
loaded via a namespace (and not attached): ggdendro(v.0.1.23), httr(v.1.4.6), sass(v.0.4.6), bit64(v.4.0.5), vroom(v.1.6.3), jsonlite(v.1.8.5), viridisLite(v.0.4.2), bslib(v.0.5.0), highr(v.0.10), stats4(v.4.2.3), GenomeInfoDbData(v.1.2.9), pillar(v.1.9.0), lattice(v.0.21-8), digest(v.0.6.31), XVector(v.0.38.0), colorspace(v.2.1-0), reactR(v.0.4.4), pkgconfig(v.2.0.3), zlibbioc(v.1.44.0), tzdb(v.0.4.0), timechange(v.0.2.0), farver(v.2.1.1), generics(v.0.1.3), IRanges(v.2.32.0), ellipsis(v.0.3.2), DT(v.0.28), cachem(v.1.0.8), withr(v.2.5.0), lazyeval(v.0.2.2), cli(v.3.6.1), magrittr(v.2.0.3), crayon(v.1.5.2), evaluate(v.0.21), fansi(v.1.0.4), MASS(v.7.3-60), tools(v.4.2.3), data.table(v.1.14.8), hms(v.1.1.3), lifecycle(v.1.0.3), plotly(v.4.10.2), S4Vectors(v.0.36.0), munsell(v.0.5.0), Biostrings(v.2.66.0), compiler(v.4.2.3), jquerylib(v.0.1.4), GenomeInfoDb(v.1.34.9), rlang(v.1.1.1), grid(v.4.2.3), RCurl(v.1.98-1.12), rstudioapi(v.0.14), htmlwidgets(v.1.6.2), crosstalk(v.1.2.0), bitops(v.1.0-7), labeling(v.0.4.2), rmarkdown(v.2.21), gtable(v.0.3.3), R6(v.2.5.1), zoo(v.1.8-12), knitr(v.1.43), fastmap(v.1.1.1), bit(v.4.0.5), utf8(v.1.2.3), rprojroot(v.2.0.3), stringi(v.1.7.12), parallel(v.4.2.3), Rcpp(v.1.0.10), vctrs(v.0.6.3), tidyselect(v.1.2.0) and xfun(v.0.39)