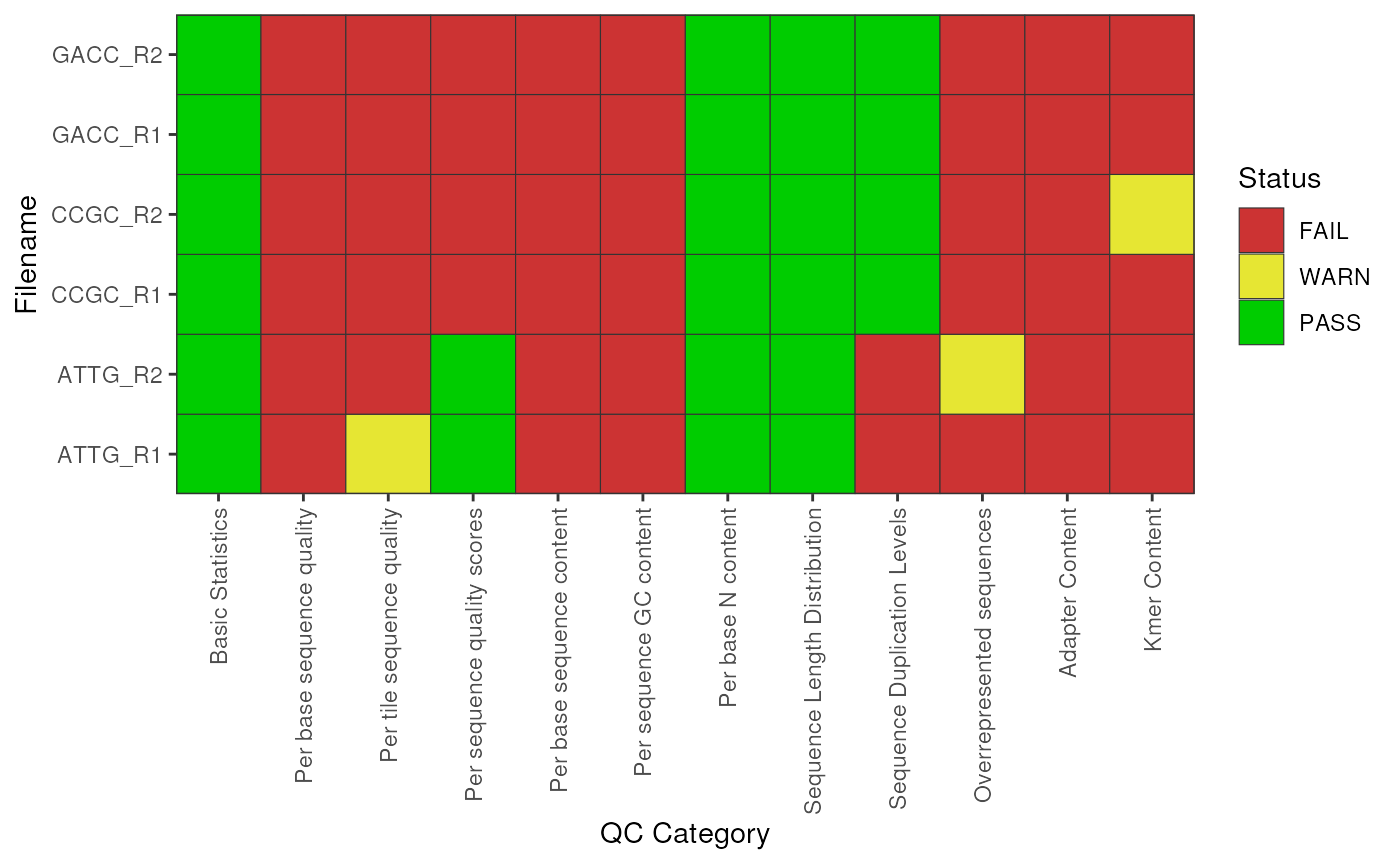
Extract the PASS/WARN/FAIL summaries and plot them
plotSummary(
  x,
  usePlotly = FALSE,
  labels,
  pwfCols,
  cluster = FALSE,
  dendrogram = FALSE,
  ...
)

# S4 method for class 'ANY'
plotSummary(
  x,
  usePlotly = FALSE,
  labels,
  pwfCols,
  cluster = FALSE,
  dendrogram = FALSE,
  ...
)

# S4 method for class 'character'
plotSummary(
  x,
  usePlotly = FALSE,
  labels,
  pwfCols,
  cluster = FALSE,
  dendrogram = FALSE,
  ...
)

# S4 method for class 'FastqcDataList'
plotSummary(
  x,
  usePlotly = FALSE,
  labels,
  pwfCols,
  cluster = FALSE,
  dendrogram = FALSE,
  ...,
  gridlineWidth = 0.2,
  gridlineCol = "grey20"
)
Arguments
- x
Can be a
FastqcData,FastqcDataListor character vector of file paths- usePlotly
logical. Generate an interactive plot using plotly- labels
An optional named vector of labels for the file names. All filenames must be present in the names. File extensions are dropped by default.
- pwfCols
Object of class
PwfCols()containing the colours for PASS/WARN/FAIL- cluster
logicaldefaultFALSE. If set toTRUE, fastqc data will be clustered using hierarchical clustering- dendrogram
logicalredundant ifclusterisFALSEif bothclusteranddendrogramare specified asTRUEthen the dendrogram will be displayed.- ...
Used to pass various potting parameters to theme.
- gridlineWidth, gridlineCol
Passed to geom_hline and geom_vline to determine width and colour of gridlines
Value
A ggplot2 object (usePlotly = FALSE)
or an interactive plotly object (usePlotly = TRUE)
Details
This uses the standard ggplot2 syntax to create a three colour plot. The output of this function can be further modified using the standard ggplot2 methods if required.
Examples
# Get the files included with the package
packageDir <- system.file("extdata", package = "ngsReports")
fl <- list.files(packageDir, pattern = "fastqc.zip", full.names = TRUE)

# Load the FASTQC data as a FastqcDataList object
fdl <- FastqcDataList(fl)

# Check the overall PASS/WARN/FAIL status
plotSummary(fdl)
