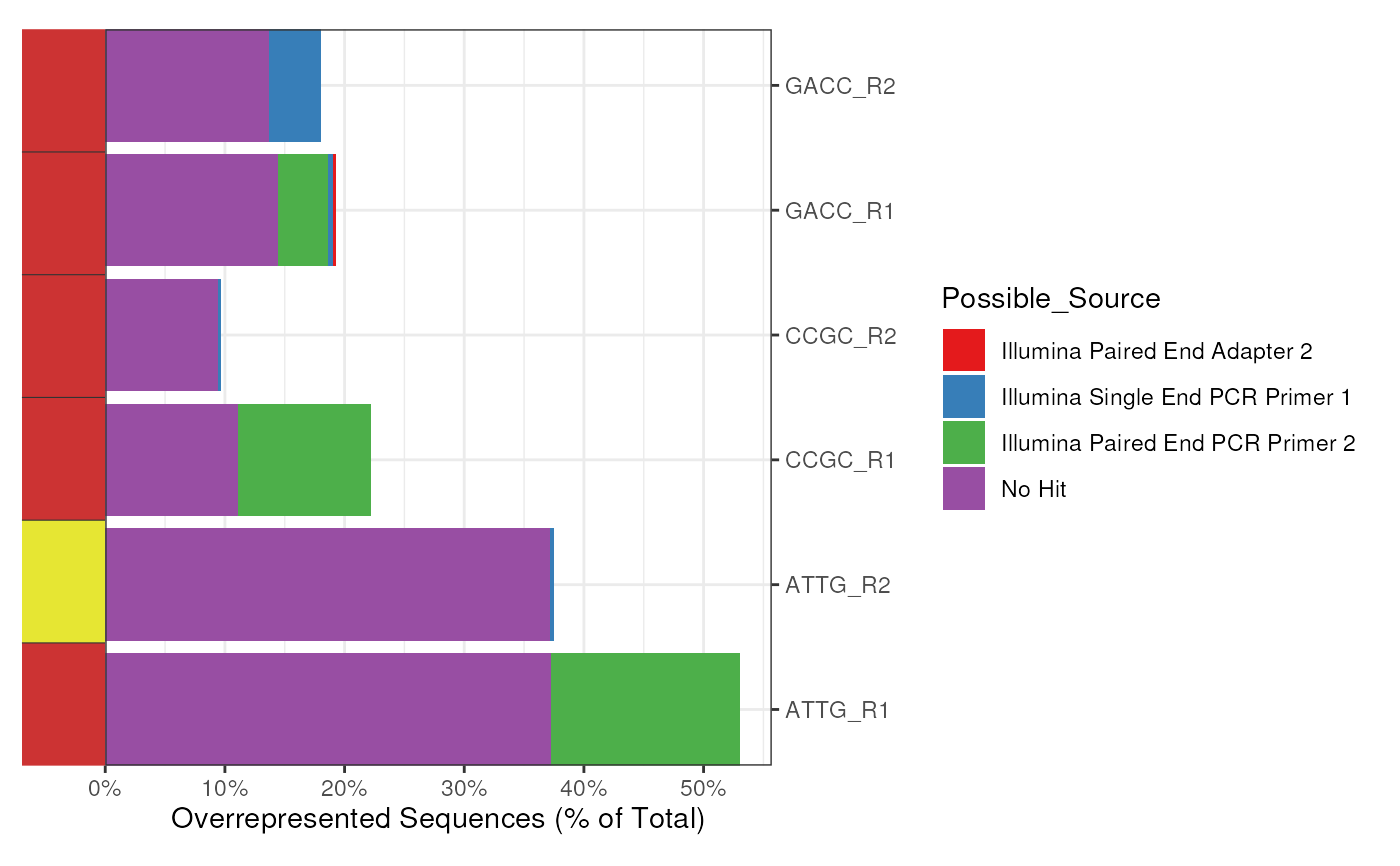
Plot a summary of Over-represented Sequences for a set of FASTQC reports
plotOverrep(
  x,
  usePlotly = FALSE,
  labels,
  pattern = ".(fast|fq|bam).*",
  pwfCols,
  ...
)

# S4 method for class 'ANY'
plotOverrep(
  x,
  usePlotly = FALSE,
  labels,
  pattern = ".(fast|fq|bam).*",
  pwfCols,
  ...
)

# S4 method for class 'character'
plotOverrep(
  x,
  usePlotly = FALSE,
  labels,
  pattern = ".(fast|fq|bam).*",
  pwfCols,
  ...
)

# S4 method for class 'FastqcData'
plotOverrep(
  x,
  usePlotly = FALSE,
  labels,
  pattern = ".(fast|fq|bam).*",
  pwfCols,
  n = 10,
  expand.x = c(0, 0, 0.05, 0),
  expand.y = c(0, 0.6, 0, 0.6),
  plotlyLegend = FALSE,
  ...
)

# S4 method for class 'FastqcDataList'
plotOverrep(
  x,
  usePlotly = FALSE,
  labels,
  pattern = ".(fast|fq|bam).*",
  pwfCols,
  showPwf = TRUE,
  cluster = FALSE,
  dendrogram = FALSE,
  scaleFill = NULL,
  paletteName = "Set1",
  panel_w = 8,
  expand.x = c(0, 0, 0.05, 0),
  expand.y = rep(0, 4),
  ...
)
Arguments
- x
Can be a
FastqcData,FastqcDataListor file paths- usePlotly
logicalDefaultFALSEwill render using ggplot. IfTRUEplot will be rendered with plotly- labels
An optional named factor of labels for the file names. All filenames must be present in the names.
- pattern
Regex to remove from the end of any filenames
- pwfCols
Object of class
PwfCols()containing the colours for PASS/WARN/FAIL- ...
Used to pass additional attributes to theme() and between methods
- n
The number of sequences to plot from an individual file
- expand.x, expand.y
Output from
expansion()or numeric vectors of length 4. Passed toscale_*_continuous()- plotlyLegend
Show legend on interactive plots
- showPwf
Show PASS/WARN/FAIL status on the plot
- cluster
logicaldefaultFALSE. If set toTRUE, fastqc data will be clustered using hierarchical clustering- dendrogram
logicalredundant ifclusterisFALSEif bothclusteranddendrogramare specified asTRUEthen the dendrogram will be displayed.- scaleFill
ggplot scale object
- paletteName
Name of the palette for colouring the possible sources of the overrepresented sequences. Must be a palette name from
RColorBrewer. Ignored if specifying the scaleFill separately- panel_w
Width of main panel on output
Value
A standard ggplot2 object
Details
Percentages are obtained by simply summing those within a report. Any possible double counting by FastQC is ignored for the purposes of a simple approximation.
Plots generated from a FastqcData object will show the top n
sequences grouped by their predicted source & coloured by whether the
individual sequence would cause a WARN/FAIL.
Plots generated from a FastqcDataList group sequences by predicted
source and summarise as a percentage of the total reads.
Examples
# Get the files included with the package
packageDir <- system.file("extdata", package = "ngsReports")
fl <- list.files(packageDir, pattern = "fastqc.zip", full.names = TRUE)

# Load the FASTQC data as a FastqcDataList object
fdl <- FastqcDataList(fl)

# A brief summary across all FastQC reports
plotOverrep(fdl)
