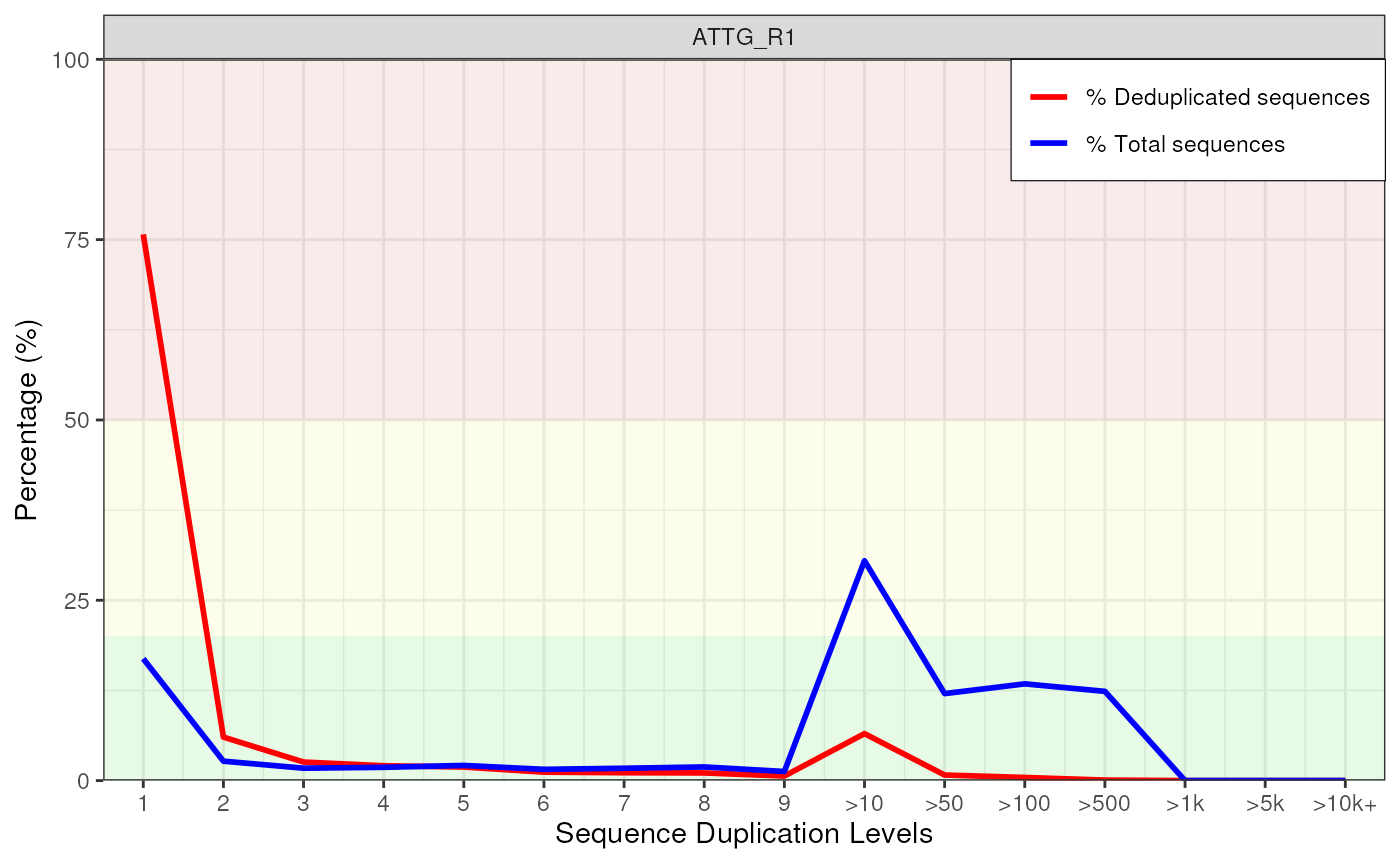
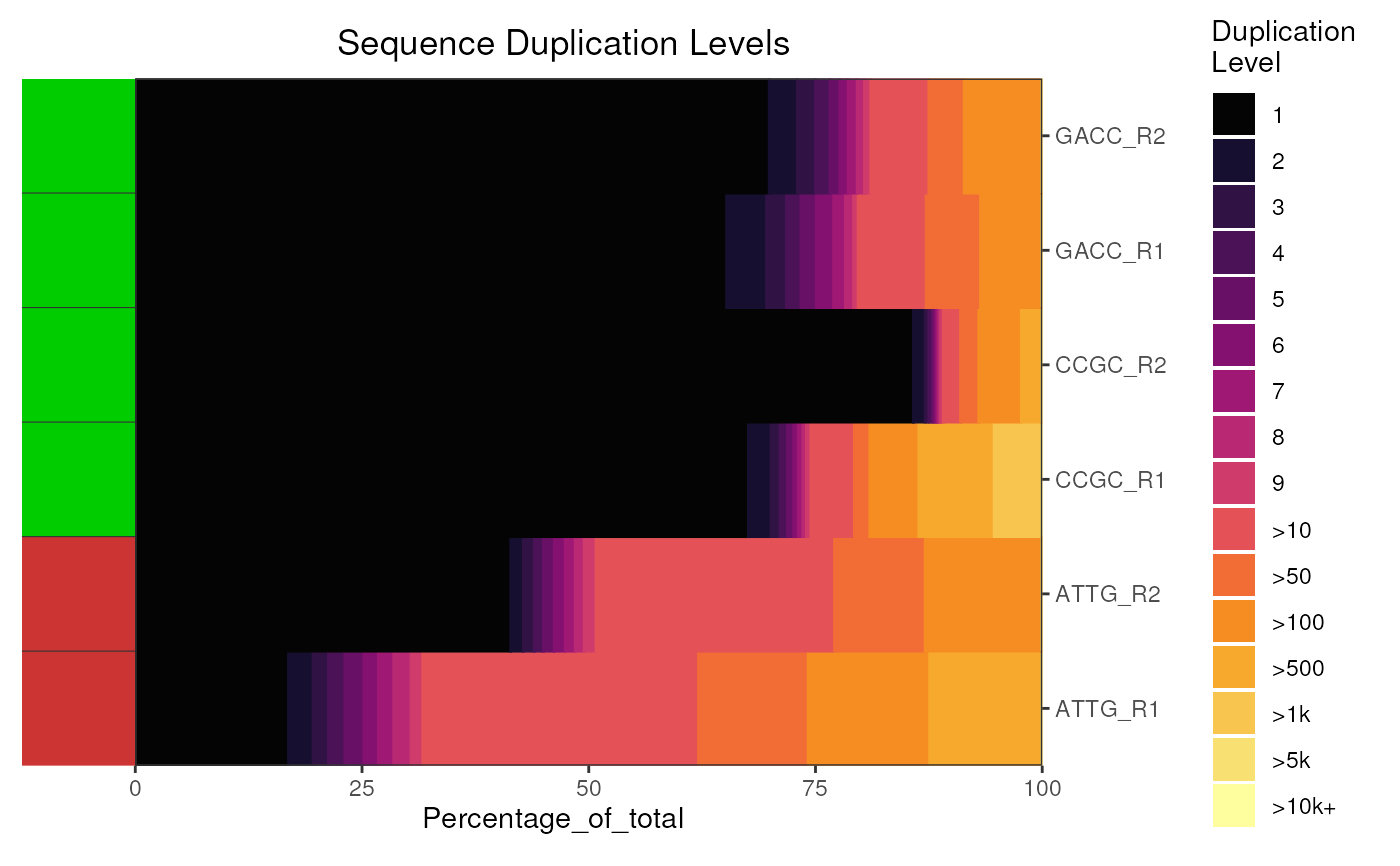
Plot the combined Sequence_Duplication_Levels information
Source:R/plotDupLevels.R
plotDupLevels-methods.RdPlot the Sequence_Duplication_Levels information for a set of FASTQC reports
plotDupLevels(x, usePlotly = FALSE, labels, pattern = ".(fast|fq|bam).*", ...)

# S4 method for class 'ANY'
plotDupLevels(x, usePlotly = FALSE, labels, pattern = ".(fast|fq|bam).*", ...)

# S4 method for class 'FastqcData'
plotDupLevels(
  x,
  usePlotly = FALSE,
  labels,
  pattern = ".(fast|fq|bam).*",
  pwfCols,
  warn = 20,
  fail = 50,
  showPwf = TRUE,
  plotlyLegend = FALSE,
  lineCol = c("red", "blue"),
  lineWidth = 1,
  ...
)

# S4 method for class 'FastqcDataList'
plotDupLevels(
  x,
  usePlotly = FALSE,
  labels,
  pattern = ".(fast|fq|bam).*",
  pwfCols,
  warn = 20,
  fail = 50,
  showPwf = TRUE,
  plotlyLegend = FALSE,
  deduplication = c("pre", "post"),
  plotType = c("heatmap", "line"),
  cluster = FALSE,
  dendrogram = FALSE,
  heatCol = hcl.colors(50, "inferno"),
  heat_w = 8,
  ...
)

# S4 method for class 'FastpData'
plotDupLevels(
  x,
  usePlotly = FALSE,
  labels,
  pattern = ".(fast|fq|bam).*",
  pwfCols,
  warn = 20,
  fail = 50,
  showPwf = FALSE,
  maxLevel = 10,
  lineCol = "red",
  barFill = "dodgerblue4",
  barCol = barFill,
  plotlyLegend = FALSE,
  plotTheme = theme_get(),
  ...
)

# S4 method for class 'FastpDataList'
plotDupLevels(
  x,
  usePlotly = FALSE,
  labels,
  pattern = ".(fast|fq|bam).*",
  pwfCols,
  warn = 20,
  fail = 50,
  showPwf = FALSE,
  plotlyLegend = FALSE,
  plotType = c("bar", "heatmap"),
  barFill = "blue",
  barCol = "blue",
  cluster = FALSE,
  dendrogram = FALSE,
  scaleFill = NULL,
  plotTheme = theme_get(),
  heat_w = 8,
  maxLevel = 10,
  ...
)
Arguments
- x
Can be a
FastqcData,FastqcDataListor file path- usePlotly
logicalDefaultFALSEwill render using ggplot. IfTRUEplot will be rendered with plotly- labels
An optional named vector of labels for the file names. All filenames must be present in the names. File extensions are dropped by default.
- pattern
regex to remove from the end of fastp & fastq file names
- ...
Used to pass additional attributes to theme() and between methods
- pwfCols
Object of class
PwfCols()to give colours for pass, warning, and fail values in the plot- warn, fail
The default values for warn and fail are 20 and 50 respectively (i.e. percentages)
- showPwf
logical(1) Show PWF rectangles in the background
- plotlyLegend
logical(1) Show legend for line plots when using interactive plots
- lineCol, lineWidth
Colours and width of lines drawn
- deduplication
Plot Duplication levels 'pre' or 'post' deduplication. Can only take values "pre" and "post"
- plotType
Choose between "heatmap" and "line"
- cluster
logicaldefaultFALSE. If set toTRUE, fastqc data will be clustered using hierarchical clustering- dendrogram
logicalPlot will automatically be clustered if TRUE.- heatCol
Colour palette used for the heatmap
- heat_w
Relative width of the heatmap relative to other plot components
- maxLevel
The maximum duplication level to plot. Beyond this level, all values will be summed
- barFill, barCol
Colours for bars when calling geom_col()
- plotTheme
theme object. Applied after a call to theme_bw()
- scaleFill
Discrete scale used to fill heatmap cells
Value
A standard ggplot2 or plotly object
Details
This extracts the Sequence_Duplication_Levels from the supplied object and generates a ggplot2 object, with a set of minimal defaults. For multiple reports, this defaults to a heatmap with block sizes proportional to the percentage of reads belonging to that duplication category.
If setting usePlotly = FALSE, the output of this function can be
further modified using standard ggplot2 syntax. If setting
usePlotly = TRUE an interactive plotly object will be produced.
Examples
# Get the files included with the package
packageDir <- system.file("extdata", package = "ngsReports")
fl <- list.files(packageDir, pattern = "fastqc.zip", full.names = TRUE)

# Load the FASTQC data as a FastqcDataList object
fdl <- FastqcDataList(fl)

# Draw the default plot for a single file
plotDupLevels(fdl[[1]])


plotDupLevels(fdl)
