Plot RLE for a given assay within a SummarizedExperiment
Source:R/AllGenerics.R, R/plotAssayRle.R
plotAssayRle-methods.RdPlot RLE for a given assay within a SummarizedExperiment
plotAssayRle(x, ...)

# S4 method for class 'SummarizedExperiment'
plotAssayRle(
  x,
  assay = "counts",
  colour = NULL,
  fill = NULL,
  rle_group = NULL,
  by_x = "colnames",
  n_max = Inf,
  trans = NULL,
  ...
)
Arguments
- x
A SummarizedExperiment object
- ...
Passed to geom_boxplot
- assay
The assay to plot
- colour
Column from
colData(x)to outline the boxplots- fill
Column from
colData(x)to fill the boxplots- rle_group
Column from
colData(x)to calculate RLE within groups Commonly an alternative sample label.- by_x
Boxplots will be drawn by this grouping variable from
colData(x). If not specified, the default values will becolnames(x)- n_max
Maximum number of points to plot
- trans
character(1). Numerical transformation to apply to the data prior to RLE calculation
Value
A ggplot2 object
Details
Uses ggplot2 to create an RLE plot for the selected assay. Any numerical
transformation prior to performing the RLE can be specified using the
trans argument
Examples
data("se")
se$treatment <- c("E2", "E2", "E2", "E2DHT", "E2DHT", "E2DHT")
se$sample <- colnames(se)
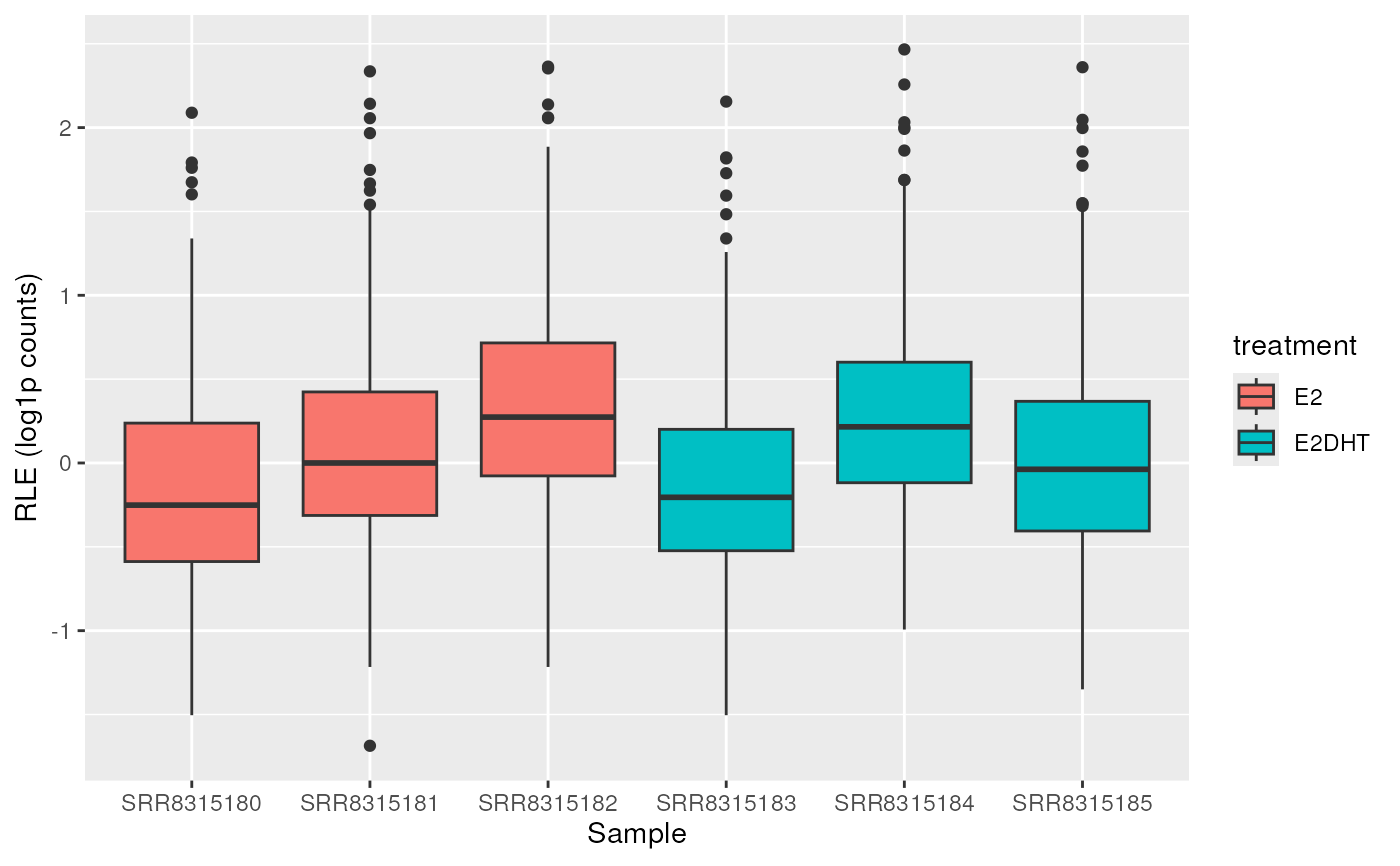
## A conventional RLE Plot using all samples
plotAssayRle(se, trans = "log1p", fill = "treatment")

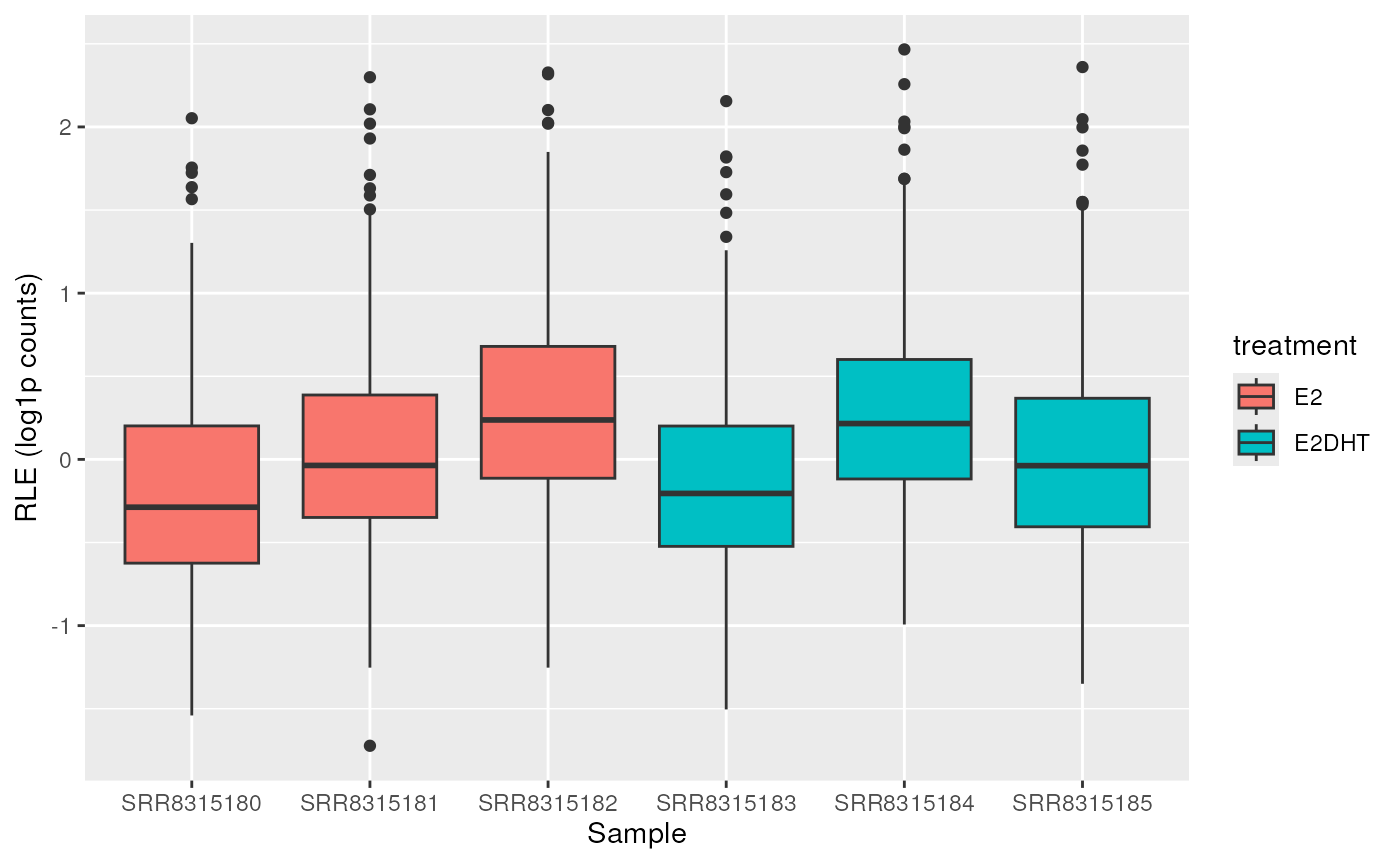
## Calculate RLE within groups
plotAssayRle(se, trans = "log1p", fill = "treatment", rle_group = "treatment")

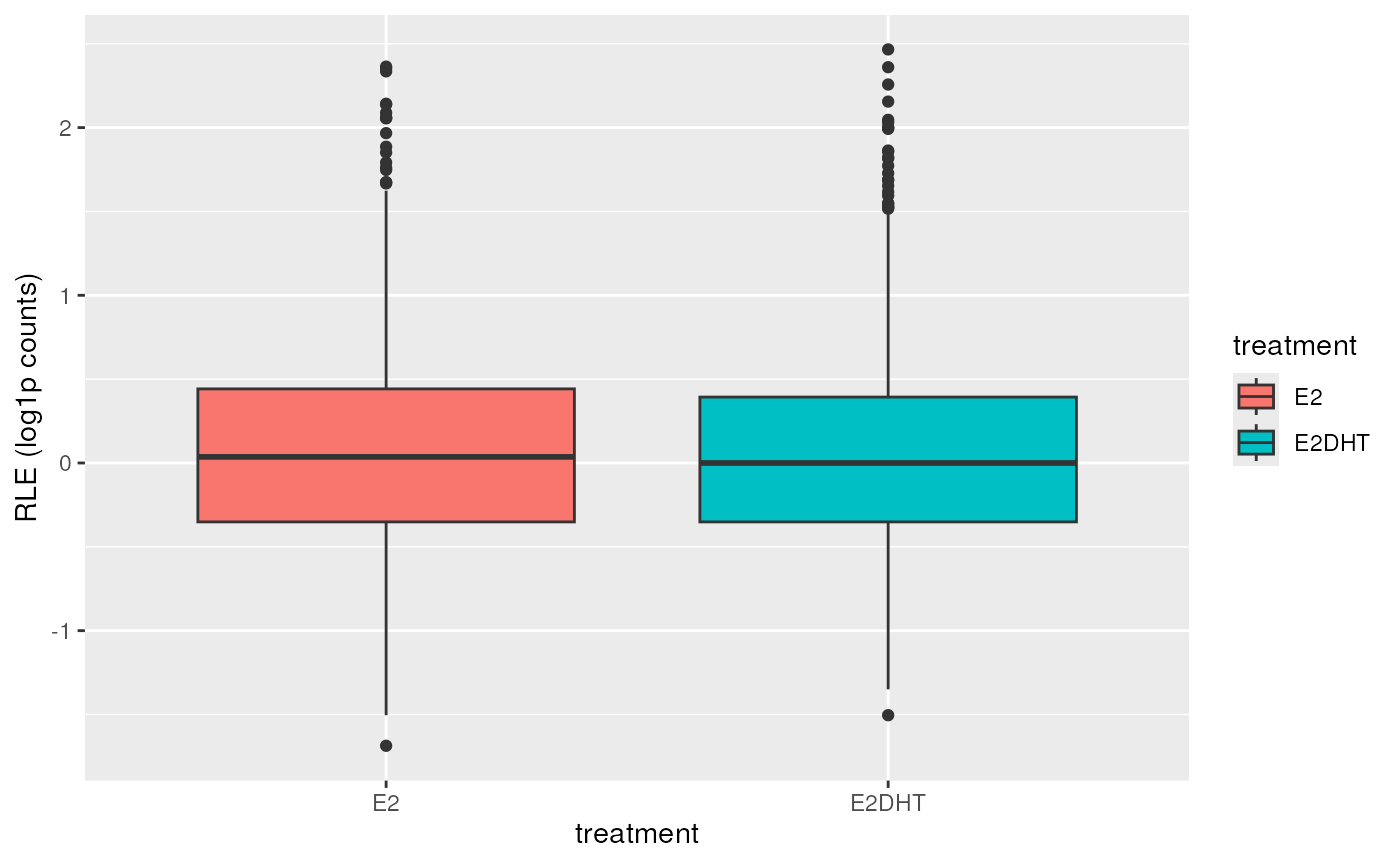
# Or show groups combined
plotAssayRle(se, trans = "log1p", fill = "treatment", by_x = "treatment")
