Plot PCA For any assay within a SummarizedExperiment
Source:R/plotAssayPCA.R
plotAssayPCA-methods.RdPlot PCA for any assay within a SummarizedExperiment object
plotAssayPCA(x, ...)

# S4 method for class 'SummarizedExperiment'
plotAssayPCA(
  x,
  assay = "counts",
  colour = NULL,
  shape = NULL,
  size = NULL,
  fill = NULL,
  label = "colnames",
  show_points = TRUE,
  pc_x = 1,
  pc_y = 2,
  trans = NULL,
  n_max = Inf,
  tol = sqrt(.Machine$double.eps),
  rank = NULL,
  ...
)
Arguments
- x
An object containing an assay slot
- ...
Passed to geom_text and geom_point
- assay
The assay to perform PCA on
- colour, size
The column names to be used for colours and point/label size. Can be fixed values (e.g. size = 3) and can also be a manipulation of a column, e.g. colour = log10(totals)
- shape, fill
The column name(s) to be used for determining the shape or fill colour of plotted points. Can also be a fixed value
- label
The column name to be used for labels. Will default to the column names of the SummarizedExperiment
- show_points
logical(1). Display the points. If
TRUEany labels will repel. IfFALSE, labels will appear at the exact points- pc_x
numeric(1) The PC to plot on the x-axis
- pc_y
numeric(1) The PC to plot on the y-axis
- trans
character(1). Any transformative function to be applied to the data before performing the PCA, e.g.
trans = "log2"- n_max
Subsample the data to this many points before performing PCA
- tol, rank
Passed to prcomp
Value
A ggplot2 object
Details
Uses ggplot2 to create a PCA plot for the selected assay. Any numerical
transformation prior to performing the PCA can be specified using the
trans argument
Examples
data("se")
se$treatment <- c("E2", "E2", "E2", "E2DHT", "E2DHT", "E2DHT")
se$sample <- colnames(se)
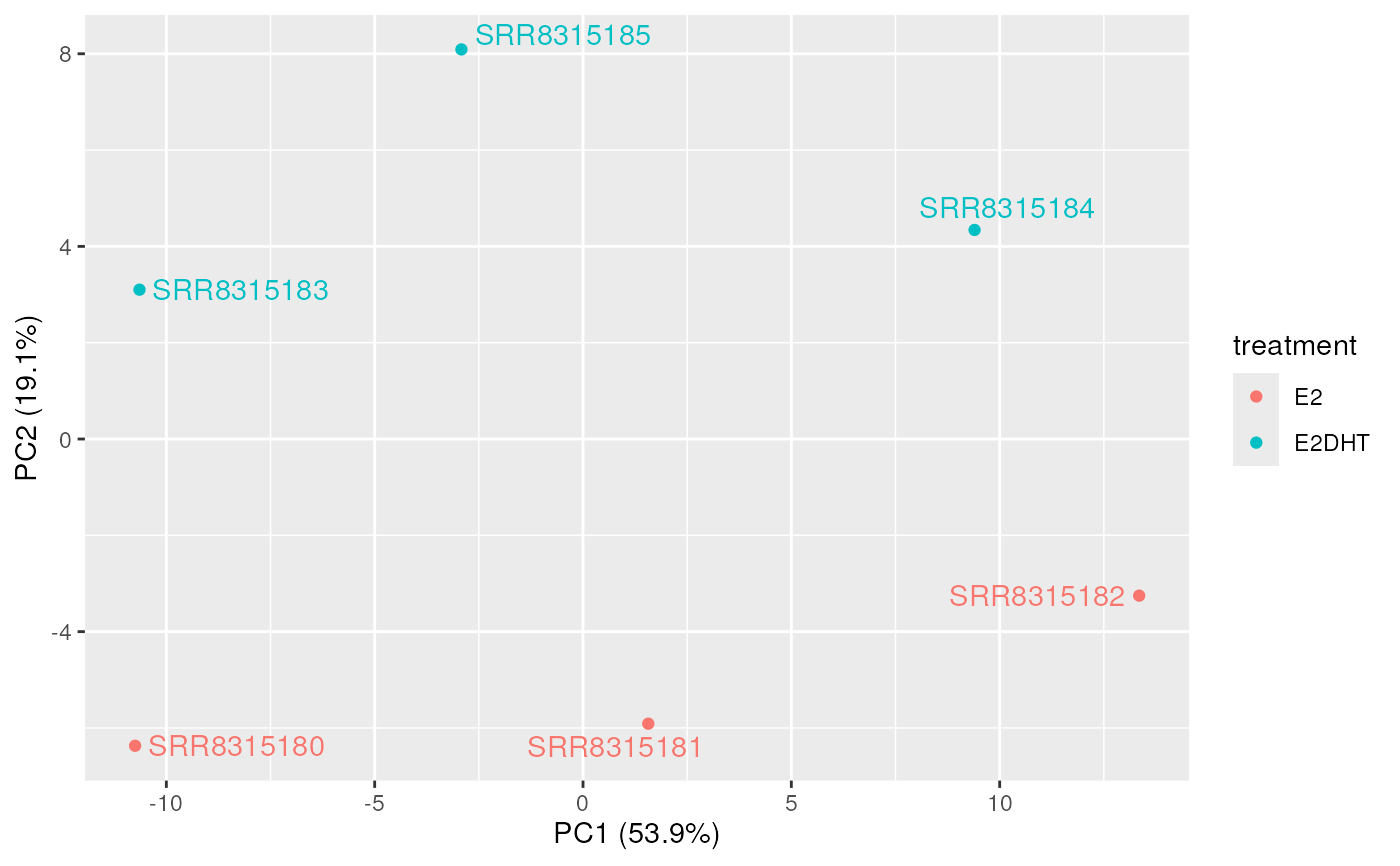
plotAssayPCA(se, trans = "log1p", colour = "treatment", label = "sample")

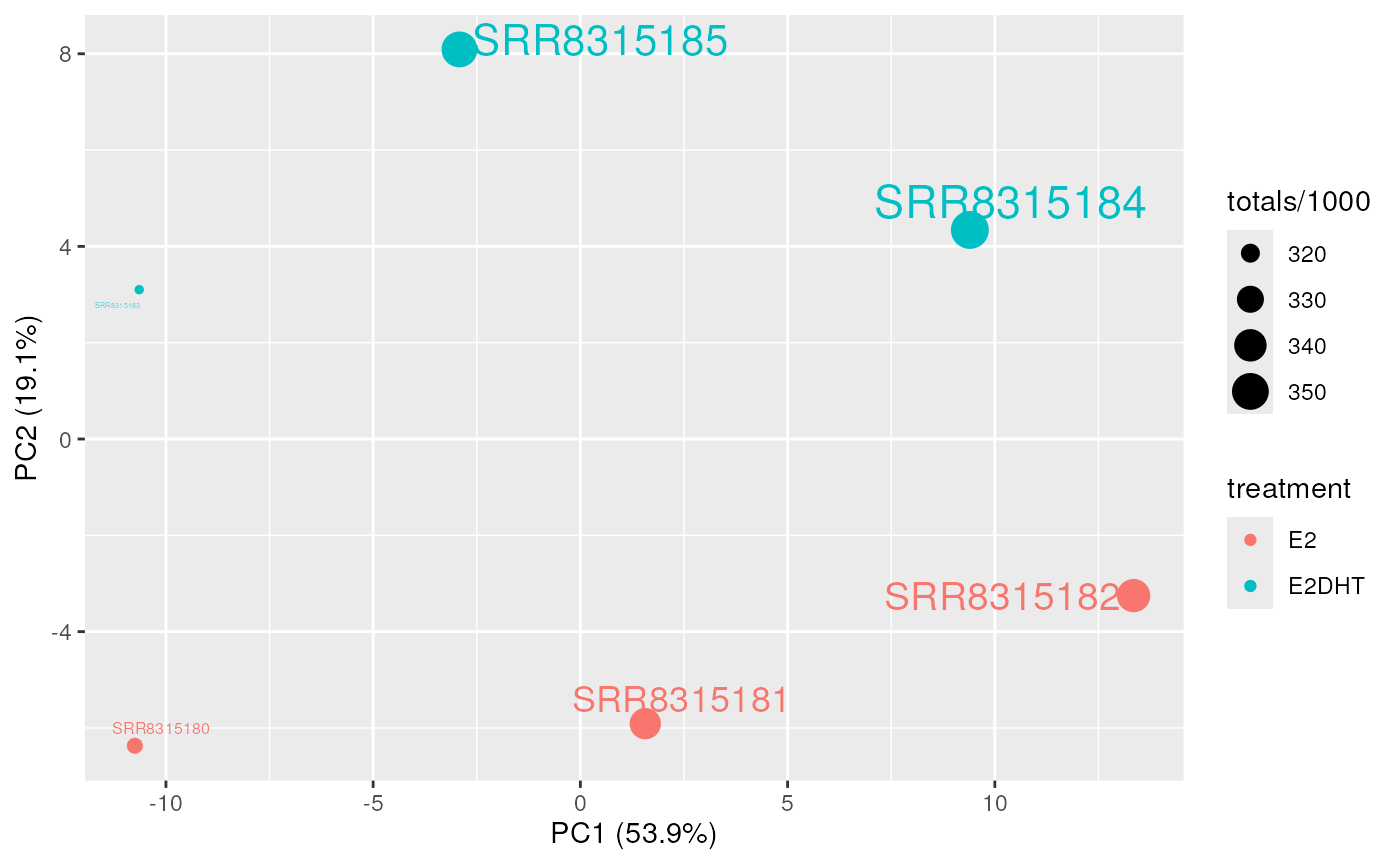
plotAssayPCA(
  se, trans = "log1p", colour = "treatment", label = "sample",
  size = log10(totals), shape = 17
)

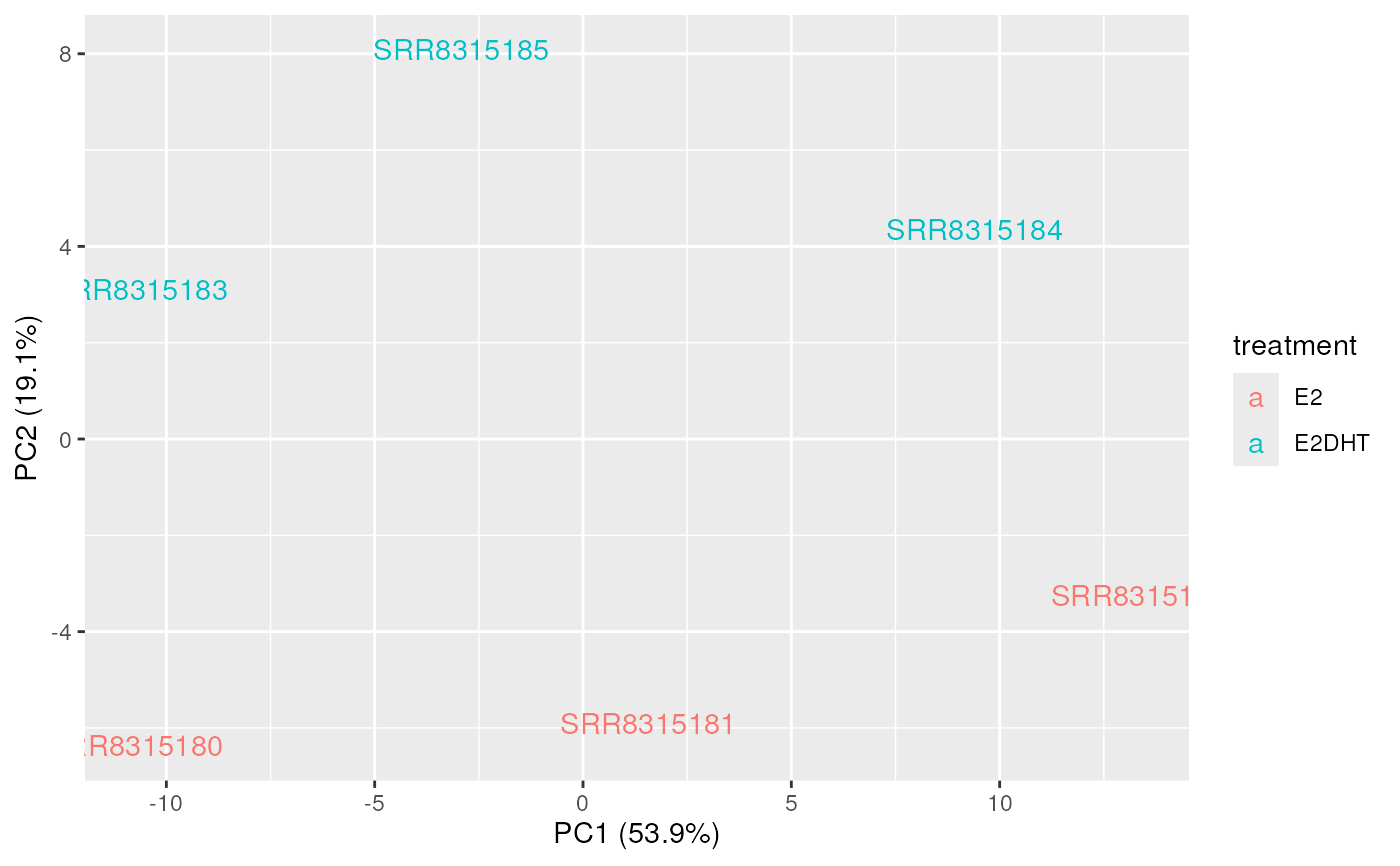
plotAssayPCA(
  se, trans = "log1p", colour = "treatment", label = "sample",
  show_points = FALSE
)
