Plot Densities for any assay within a SummarizedExperiment
Source:R/plotAssayDensities.R
plotAssayDensities-methods.RdPlot Densities for any assay within a SummarizedExperiment
plotAssayDensities(x, ...)

# S4 method for class 'SummarizedExperiment'
plotAssayDensities(
  x,
  assay = "counts",
  group = NULL,
  colour = NULL,
  fill = NULL,
  linetype = NULL,
  linewidth = NULL,
  alpha = NULL,
  trans = NULL,
  n_max = Inf,
  ...
)
Arguments
- x
A SummarizedExperiment object
- ...
Passed to geom_density
- assay
An assay within x
- group
Used by geom_line. Defaults to the column names but treatment groups can also be specified to summarise within groups
- colour, fill, alpha
Optional column in colData to set the respective aesthetics. Can also be any valid colour specification as a fixed value or a fixed alpha value
- linetype, linewidth
Any optional column in colData used to determine linetype or linewidth. Can also be fixed values
- trans
character(1). Any transformative function to be applied to the data before calculating the density, e.g.
trans = "log2"- n_max
Maximum number of points to use when calculating densities
Value
A ggplot2 object. Scales and labels can be added using conventional
ggplot2 syntax.
Details
Uses ggplot2 to create a density plot for all samples within the selected assay
Examples
data("se")
se$treatment <- c("E2", "E2", "E2", "E2DHT", "E2DHT", "E2DHT")
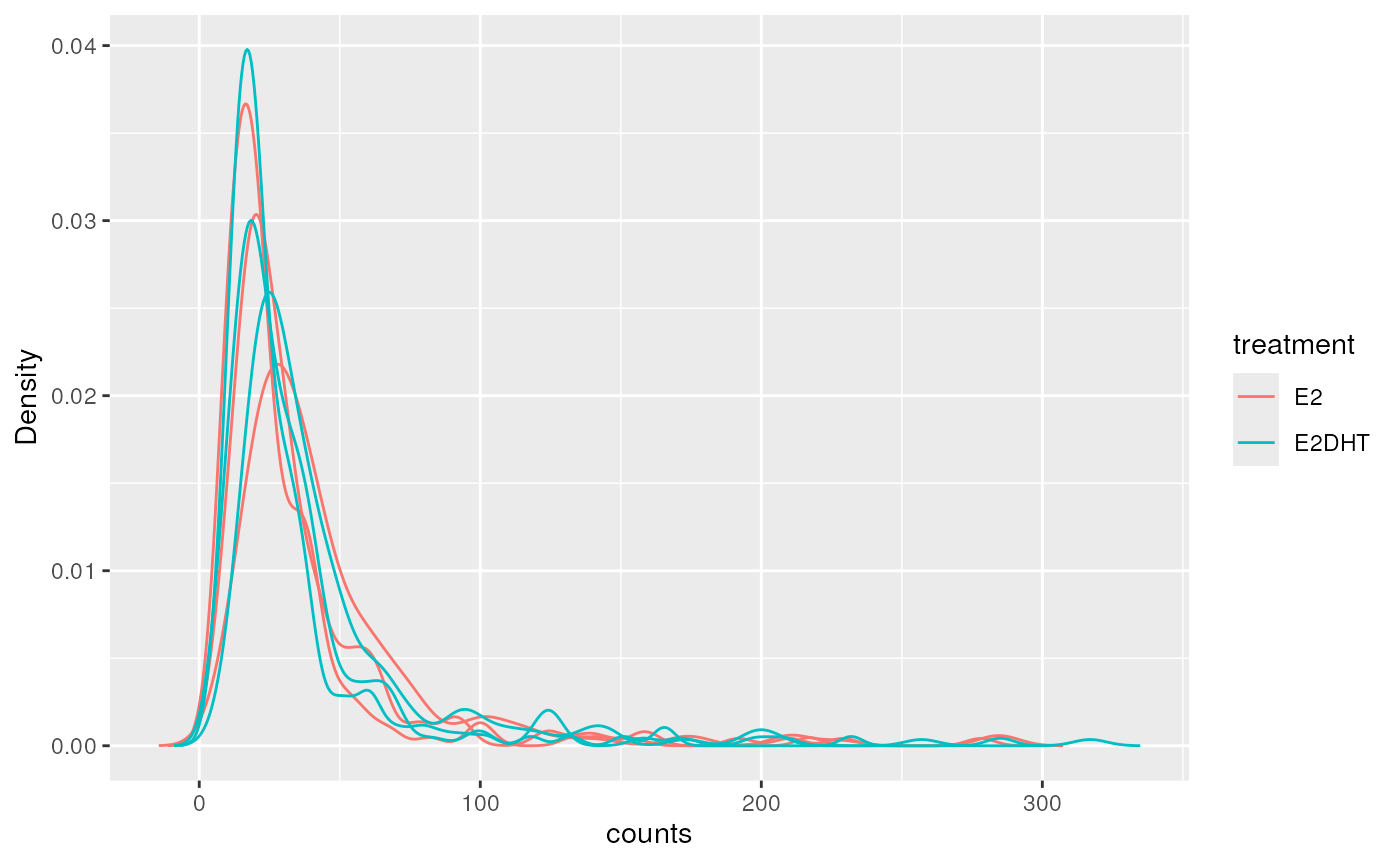
## Plot individual samples
plotAssayDensities(se, colour = "treatment")
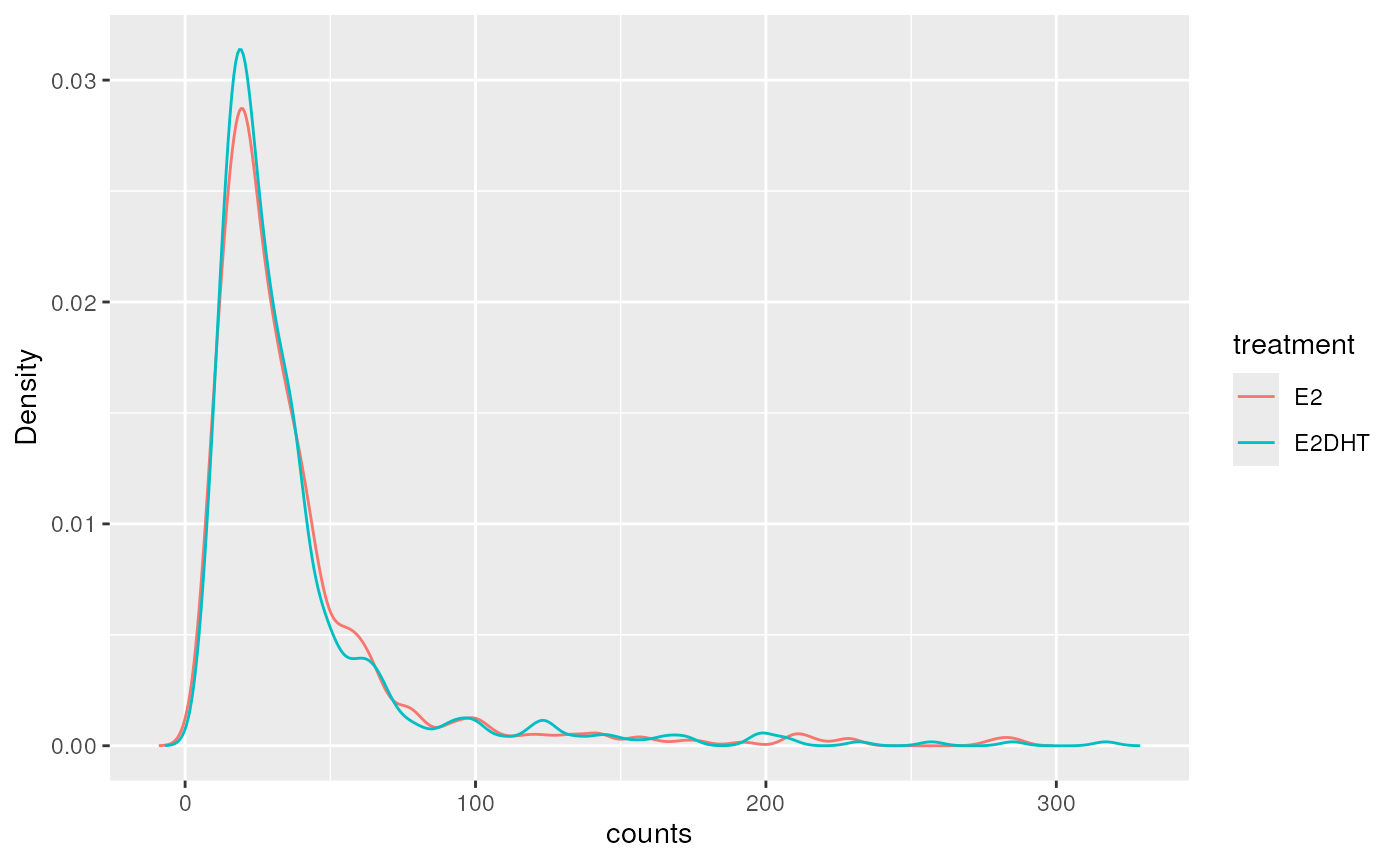
 ## Plot combined within treatment groups
plotAssayDensities(se, colour = "treatment", group = "treatment")
## Plot combined within treatment groups
plotAssayDensities(se, colour = "treatment", group = "treatment")
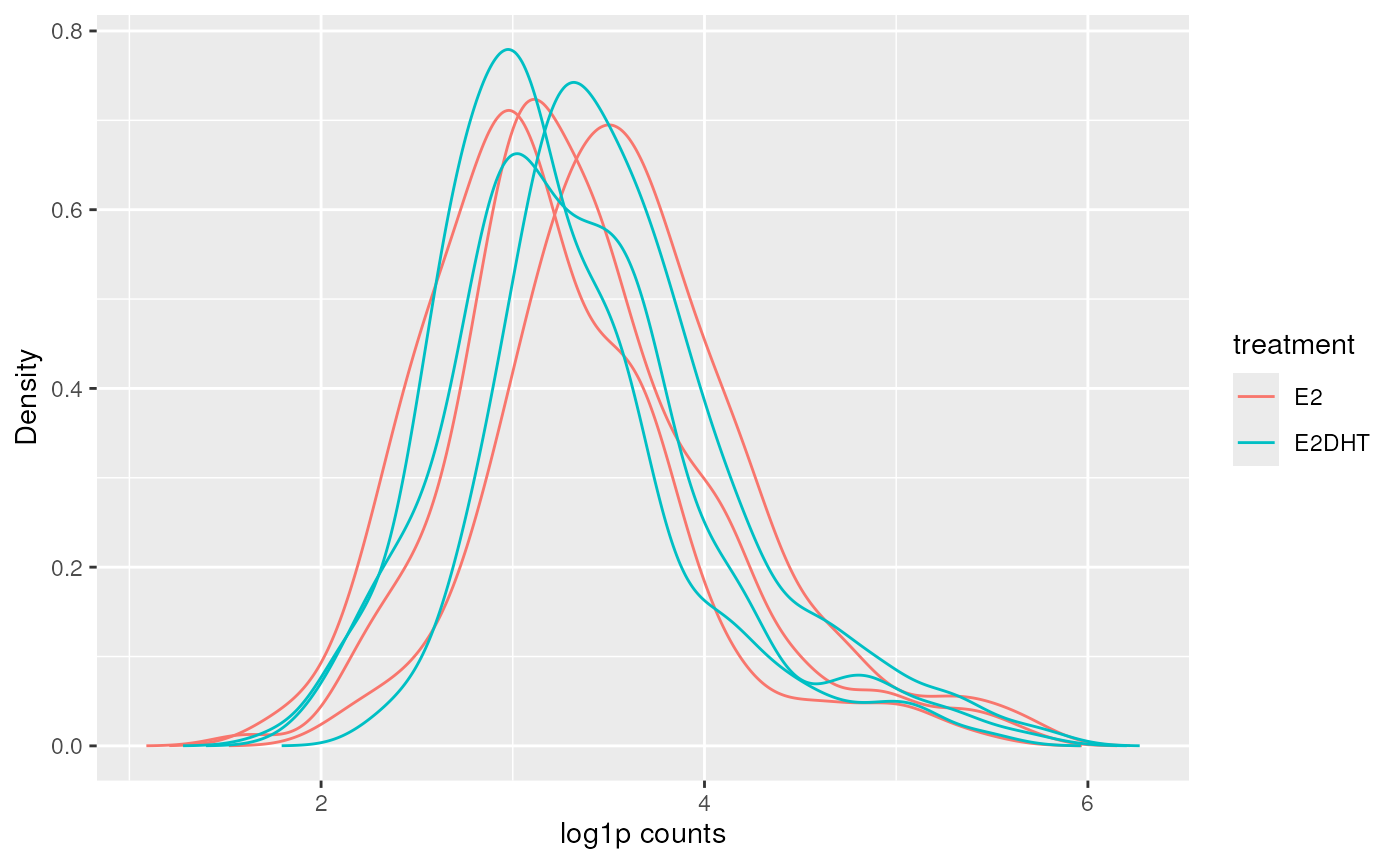
 ## Use a data transformation
plotAssayDensities(se, trans = "log1p", colour = "treat")
## Use a data transformation
plotAssayDensities(se, trans = "log1p", colour = "treat")