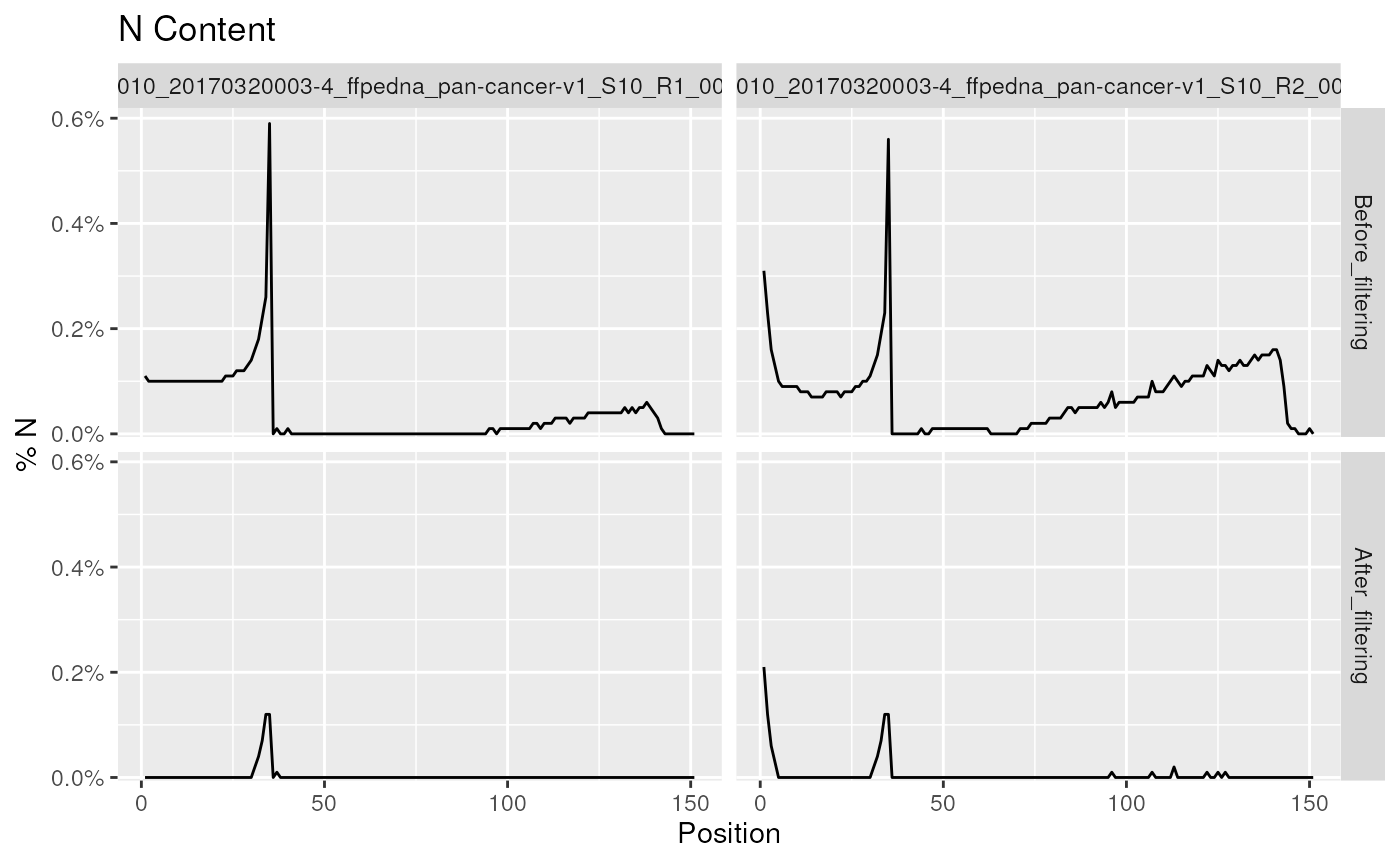
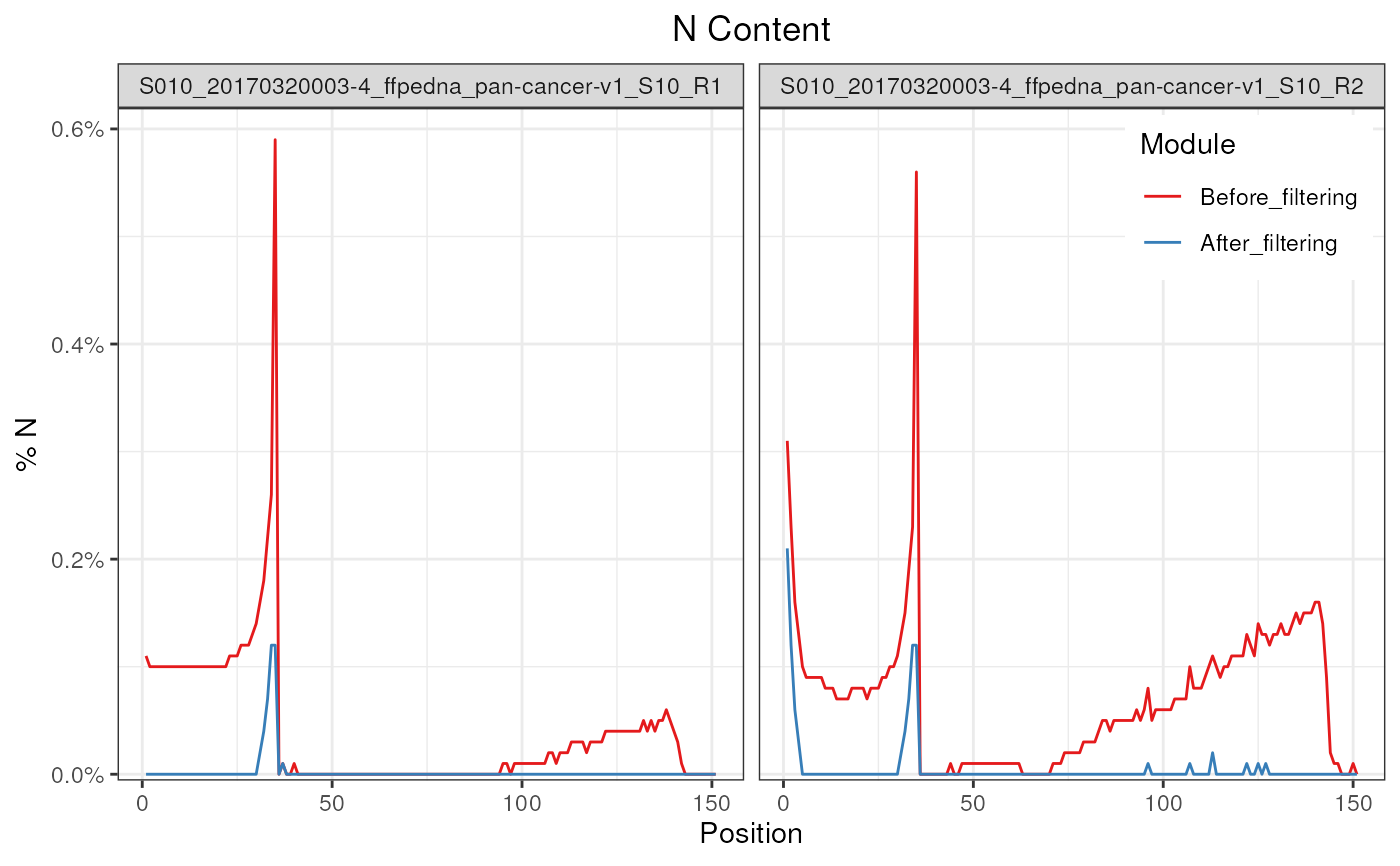
Draw an N Content Plot across one or more FastQC reports
plotNContent(x, usePlotly = FALSE, labels, pattern = ".(fast|fq|bam).*", ...)

# S4 method for class 'ANY'
plotNContent(x, usePlotly = FALSE, labels, pattern = ".(fast|fq|bam).*", ...)

# S4 method for class 'FastqcData'
plotNContent(
  x,
  usePlotly = FALSE,
  labels,
  pattern = ".(fast|fq|bam).*",
  pwfCols,
  warn = 5,
  fail = 20,
  showPwf = TRUE,
  ...,
  lineCol = "red"
)

# S4 method for class 'FastqcDataList'
plotNContent(
  x,
  usePlotly = FALSE,
  labels,
  pattern = ".(fast|fq|bam).*",
  pwfCols,
  warn = 5,
  fail = 20,
  showPwf = TRUE,
  cluster = FALSE,
  dendrogram = FALSE,
  heat_w = 8,
  scaleFill = NULL,
  ...
)

# S4 method for class 'FastpData'
plotNContent(
  x,
  usePlotly = FALSE,
  labels,
  pattern = ".(fast|fq|bam).*",
  module = c("Before_filtering", "After_filtering"),
  moduleBy = c("facet", "colour", "linetype"),
  reads = c("read1", "read2"),
  readsBy = c("facet", "colour", "linetype"),
  scaleColour = NULL,
  scaleLine = NULL,
  plotTheme = theme_get(),
  plotlyLegend = FALSE,
  ...
)

# S4 method for class 'FastpDataList'
plotNContent(
  x,
  usePlotly = FALSE,
  labels,
  pattern = ".(fast|fq|bam).*",
  module = c("Before_filtering", "After_filtering"),
  reads = c("read1", "read2"),
  scaleFill = NULL,
  plotTheme = theme_get(),
  cluster = FALSE,
  dendrogram = FALSE,
  heat_w = 8,
  ...
)
Arguments
- x
Can be a
FastqcData,FastqcDataListor file paths- usePlotly
logical. Output as ggplot2 (default) or plotly object.- labels
An optional named vector of labels for the file names. All filenames must be present in the names.
- pattern
Regex used to trim the end of filenames
- ...
Used to pass additional attributes to theme() for FastqcData objects and to geom* calls for FastpData-based objects
- pwfCols
Object of class
PwfCols()containing the colours for PASS/WARN/FAIL- warn, fail
The default values for warn and fail are 5 and 10 respectively (i.e. percentages)
- showPwf
logical(1) Show the PASS/WARN/FAIL status
- lineCol
Line colours
- cluster
logicaldefaultFALSE. If set toTRUE, fastqc data will be clustered using hierarchical clustering- dendrogram
logicalredundant ifclusterisFALSEif bothclusteranddendrogramare specified asTRUEthen the dendrogram will be displayed.- heat_w
Relative width of any heatmap plot components
- scaleFill, scaleColour, scaleLine
ggplot2 scale objects
- module
Used for Fastp* structures to show results before or after filtering
- moduleBy, readsBy
How to show each module or set of reads on the plot
- reads
Show plots for read1, read2 or both.
- plotTheme
theme object
- plotlyLegend
logical(1) Show legend on interactive plots
Value
A standard ggplot2 object, or an interactive plotly object
Details
This extracts the N_Content from the supplied object and generates a ggplot2 object, with a set of minimal defaults. The output of this function can be further modified using the standard ggplot2 methods.
When x is a single FastqcData object line plots will always be drawn
for all Ns.
Otherwise, users can select line plots or heatmaps.
Examples
## Using a Fastp Data object
fl <- system.file("extdata/fastp.json.gz", package = "ngsReports")
fp <- FastpData(fl)
plotNContent(fp)

plotNContent(
  fp, pattern = "_001.+",
  moduleBy = "colour", scaleColour = scale_colour_brewer(palette = "Set1"),
  plotTheme = theme(
    legend.position = 'inside', legend.position.inside = c(0.99, 0.99),
    legend.justification = c(1, 1), plot.title = element_text(hjust = 0.5)
  )
)
