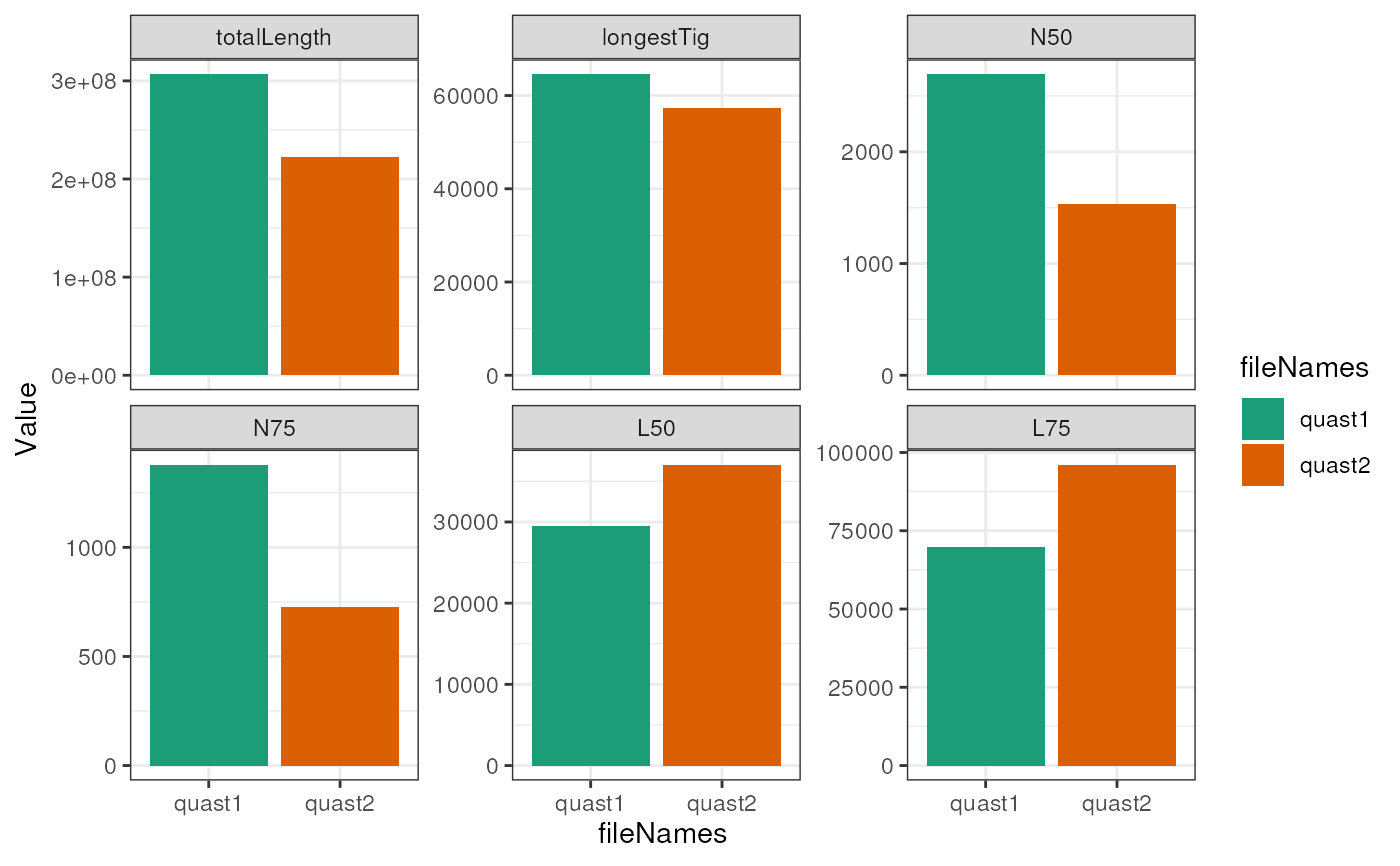
Plot a summary of assembly stats from a set of log files
Arguments
- x
Paths to one or more log files
- type
The tool used. Can be one of quast or busco
- usePlotly
logical. If TRUE an interactive plot will be generated. If FALSE a ggplot object will be output
- plotType
character. Plot type to output, one of bar or paracoord.- ...
Used to pass additional attributes to theme() and between methods
Value
A ggplot2 object, or a plotly object
Details
Loads a set of assembly log files and creates a default plot.
Implemented tools are quast and BUSCO.
quast will plot a parralel coordinate plot of some assembly statistics
BUSCO will plot a stacked barplot of completeness statistics
Examples
#getquast log filenames
quastFiles <- system.file("extdata",
c("quast1.tsv", "quast2.tsv"), package = "ngsReports")

# The default plot
plotAssemblyStats(quastFiles)
