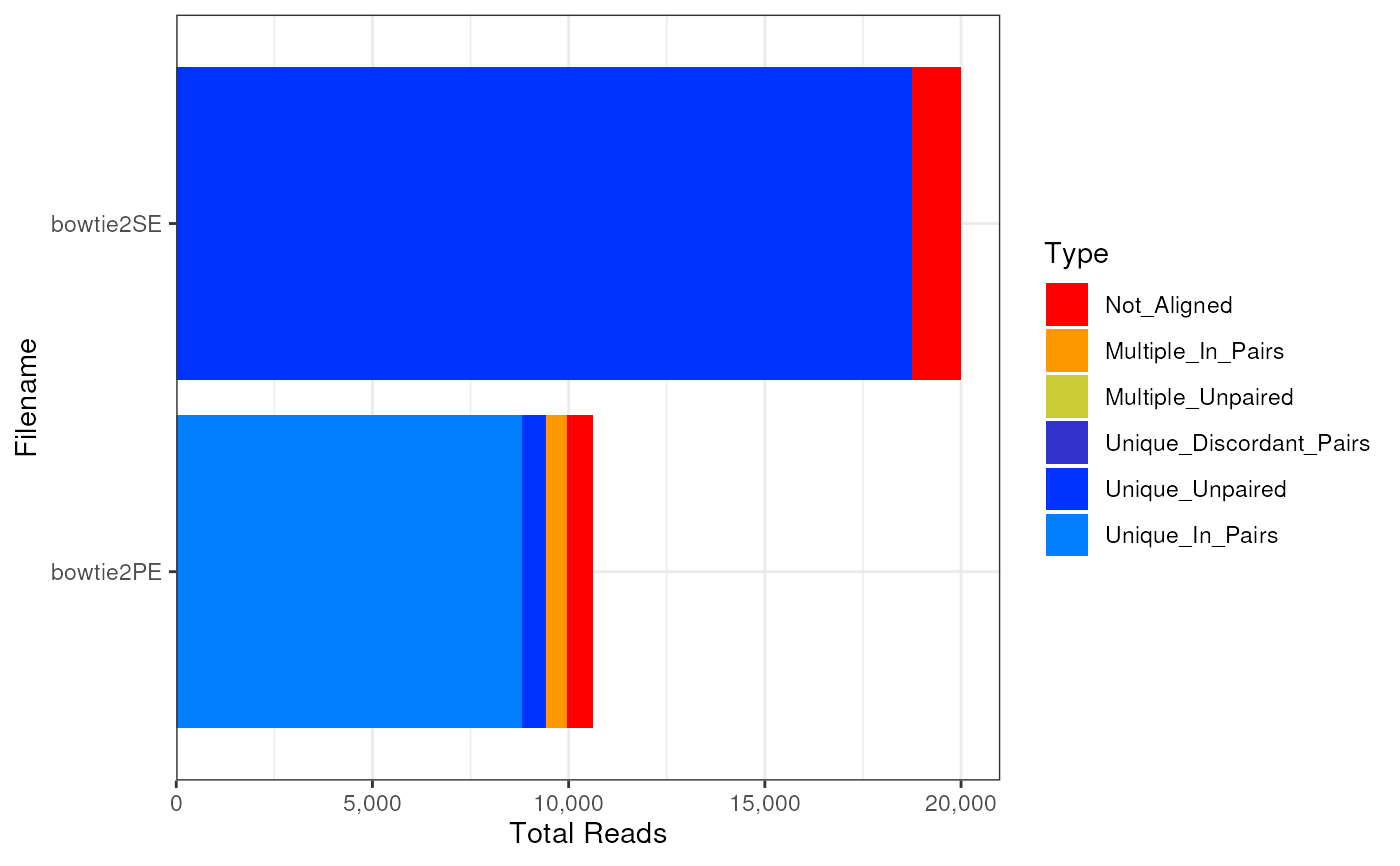
Plot a summary of alignments from a set of log files
Arguments
- x
Paths to one or more alignment log files
- type
The aligner used. Can be one of star, bowtie, bowtie2 or hisat2
- usePlotly
logical. If TRUE an interactive plot will be generated.
- stripPaths
logical(1). Remove paths from the Filename column
- asPercent
Show alignments as percentages, with the alternative (FALSE) being the total number of reads If FALSE a ggplot object will be output
- ...
Used to pass additional attributes to theme() and between methods
- fill
Colours used to fill the bars. Passed to scale_fill_manual.
Value
A ggplot2 object, or a plotly object
Details
Loads a set of alignment log files and creates a default plot.
Implemented aligners are bowtie, bowtie2, Hisat2 and
STAR.
Examples
f <- c("bowtie2PE.txt", "bowtie2SE.txt")
bowtie2Logs <- system.file("extdata", f, package = "ngsReports")
plotAlignmentSummary(bowtie2Logs, "bowtie2")
