Large Cohort Transcriptomics
Adelaide Biomed Seminar Series
March 13, 2026
Acknowledgement of Country

I would like to acknowledge that many of us are meeting today on Kaurna Country (Karrawirraparri: Redgum Forest River).
I acknowledge the deep feelings of attachment and relationship of the Kaurna people to their Place.
I also pay my respects to the cultural authority of Aboriginal and Torres Strait Islander peoples from other areas of Australia online today, and pay my respects to Elders past, present and emerging.
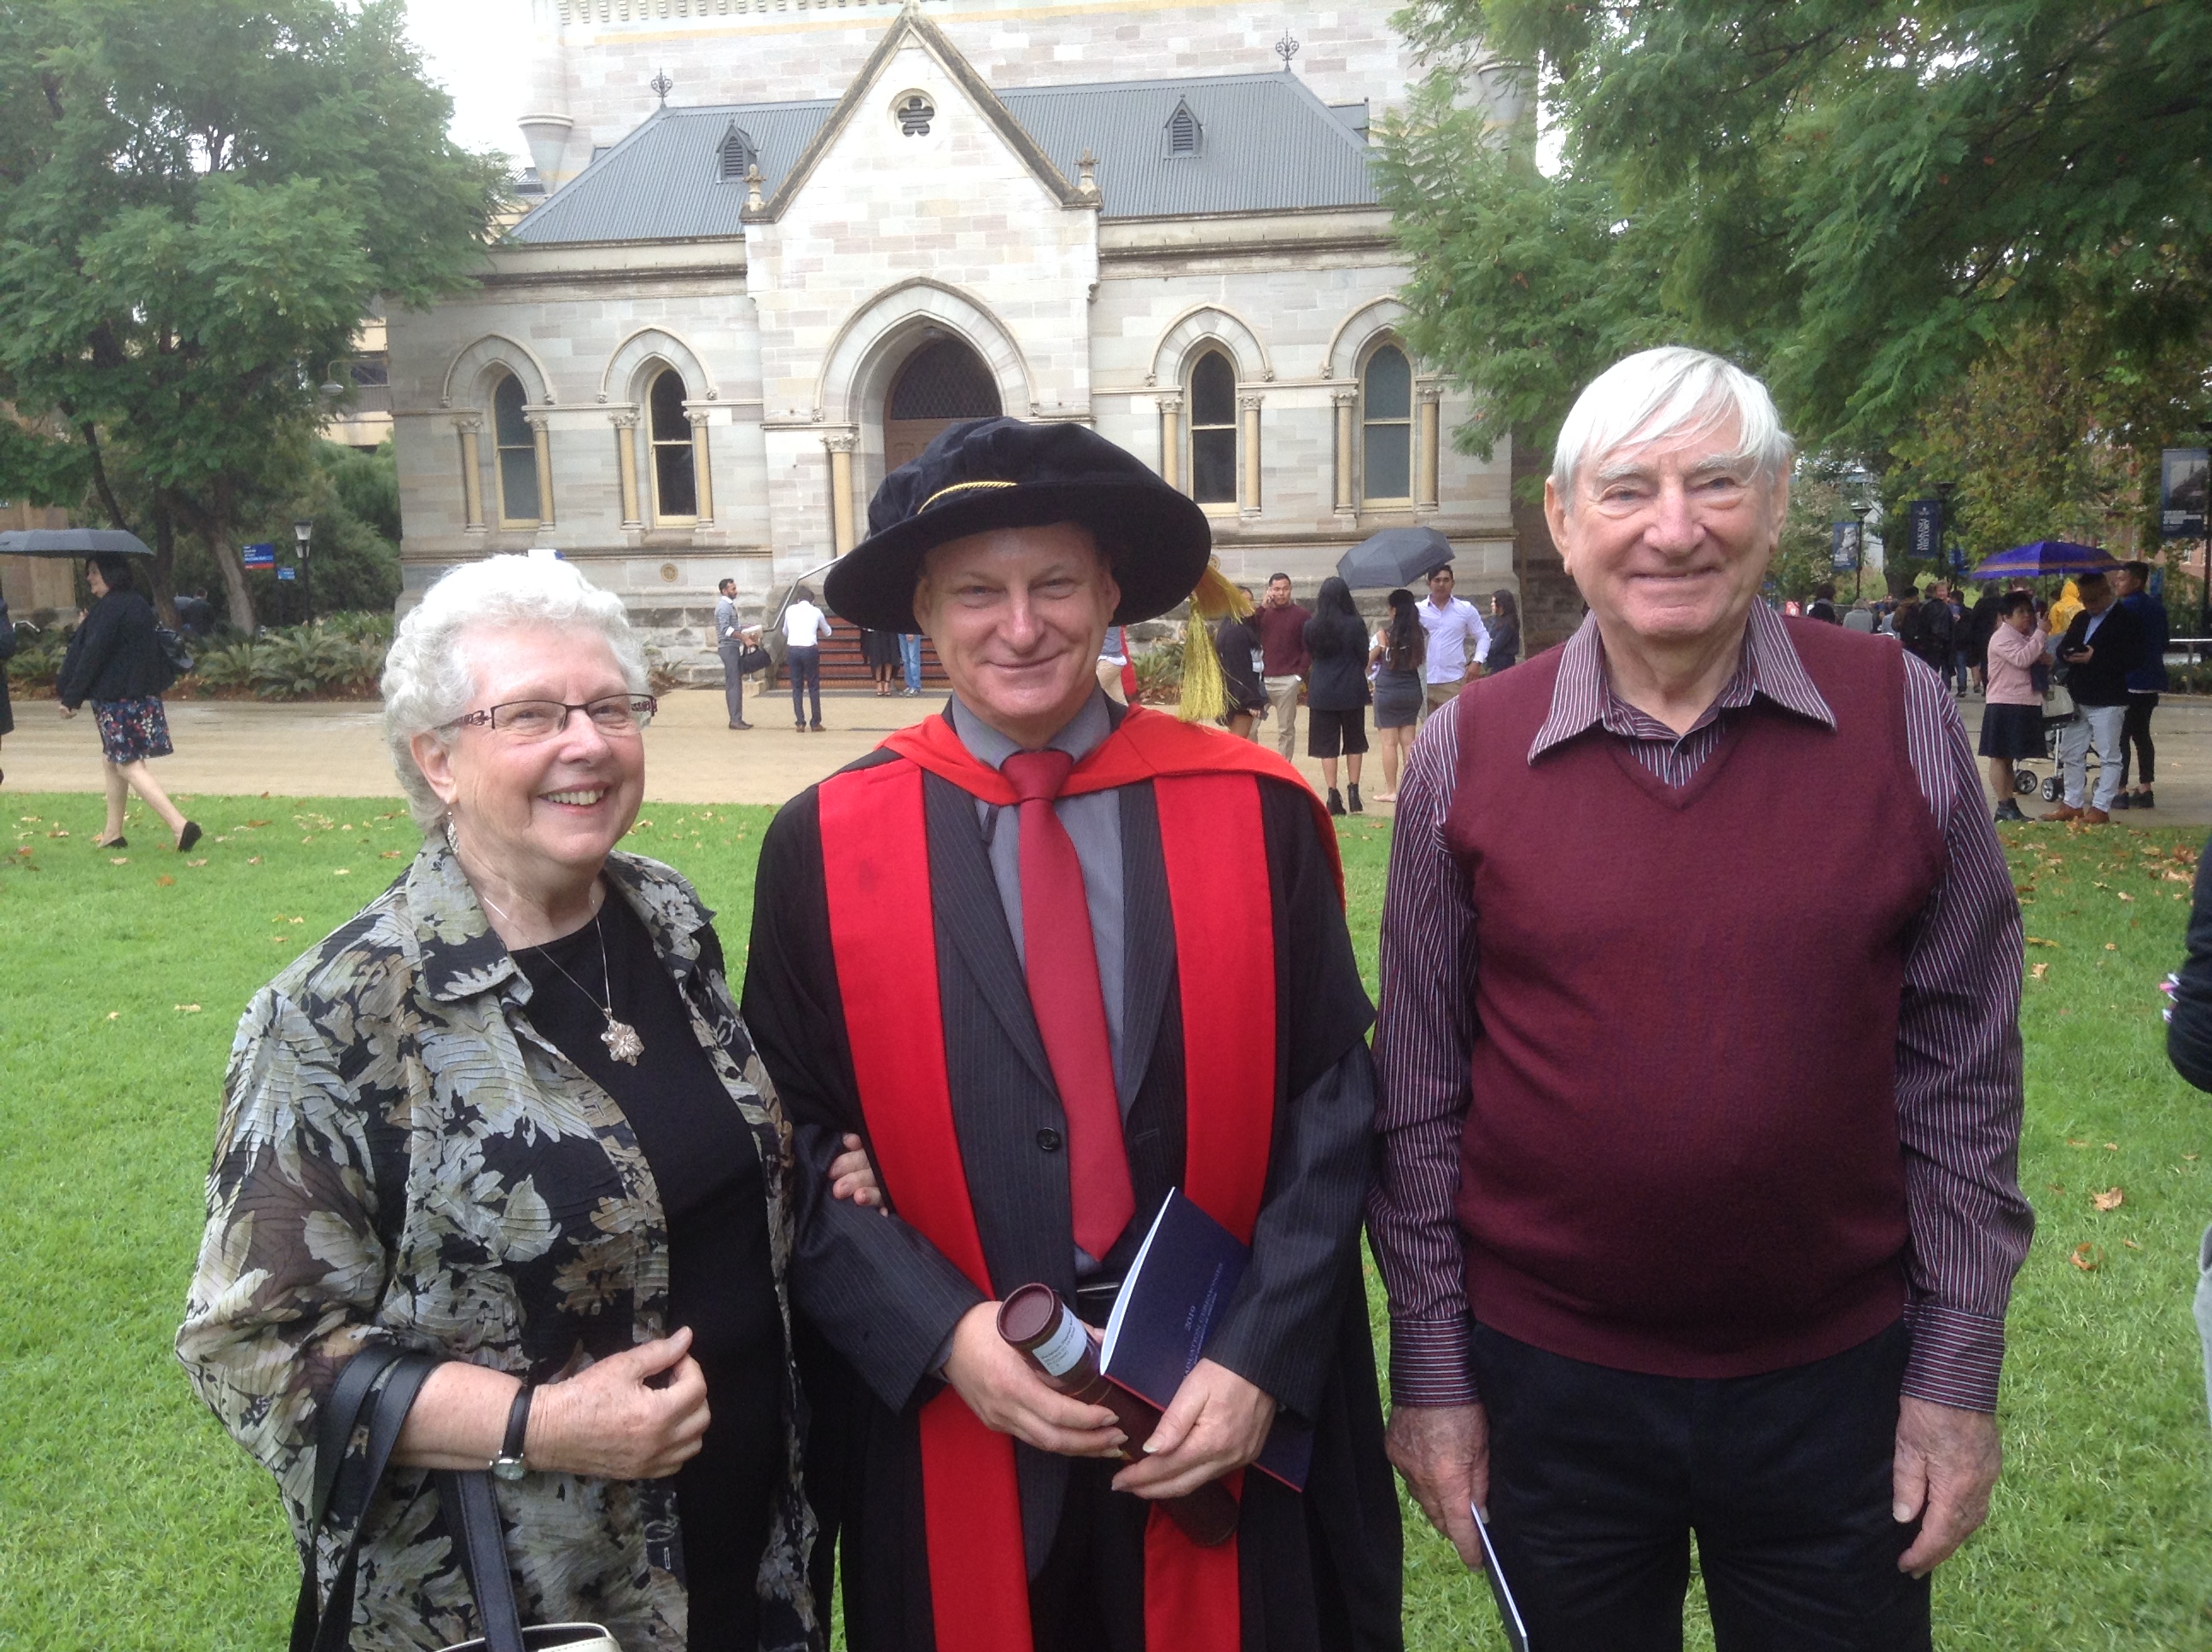
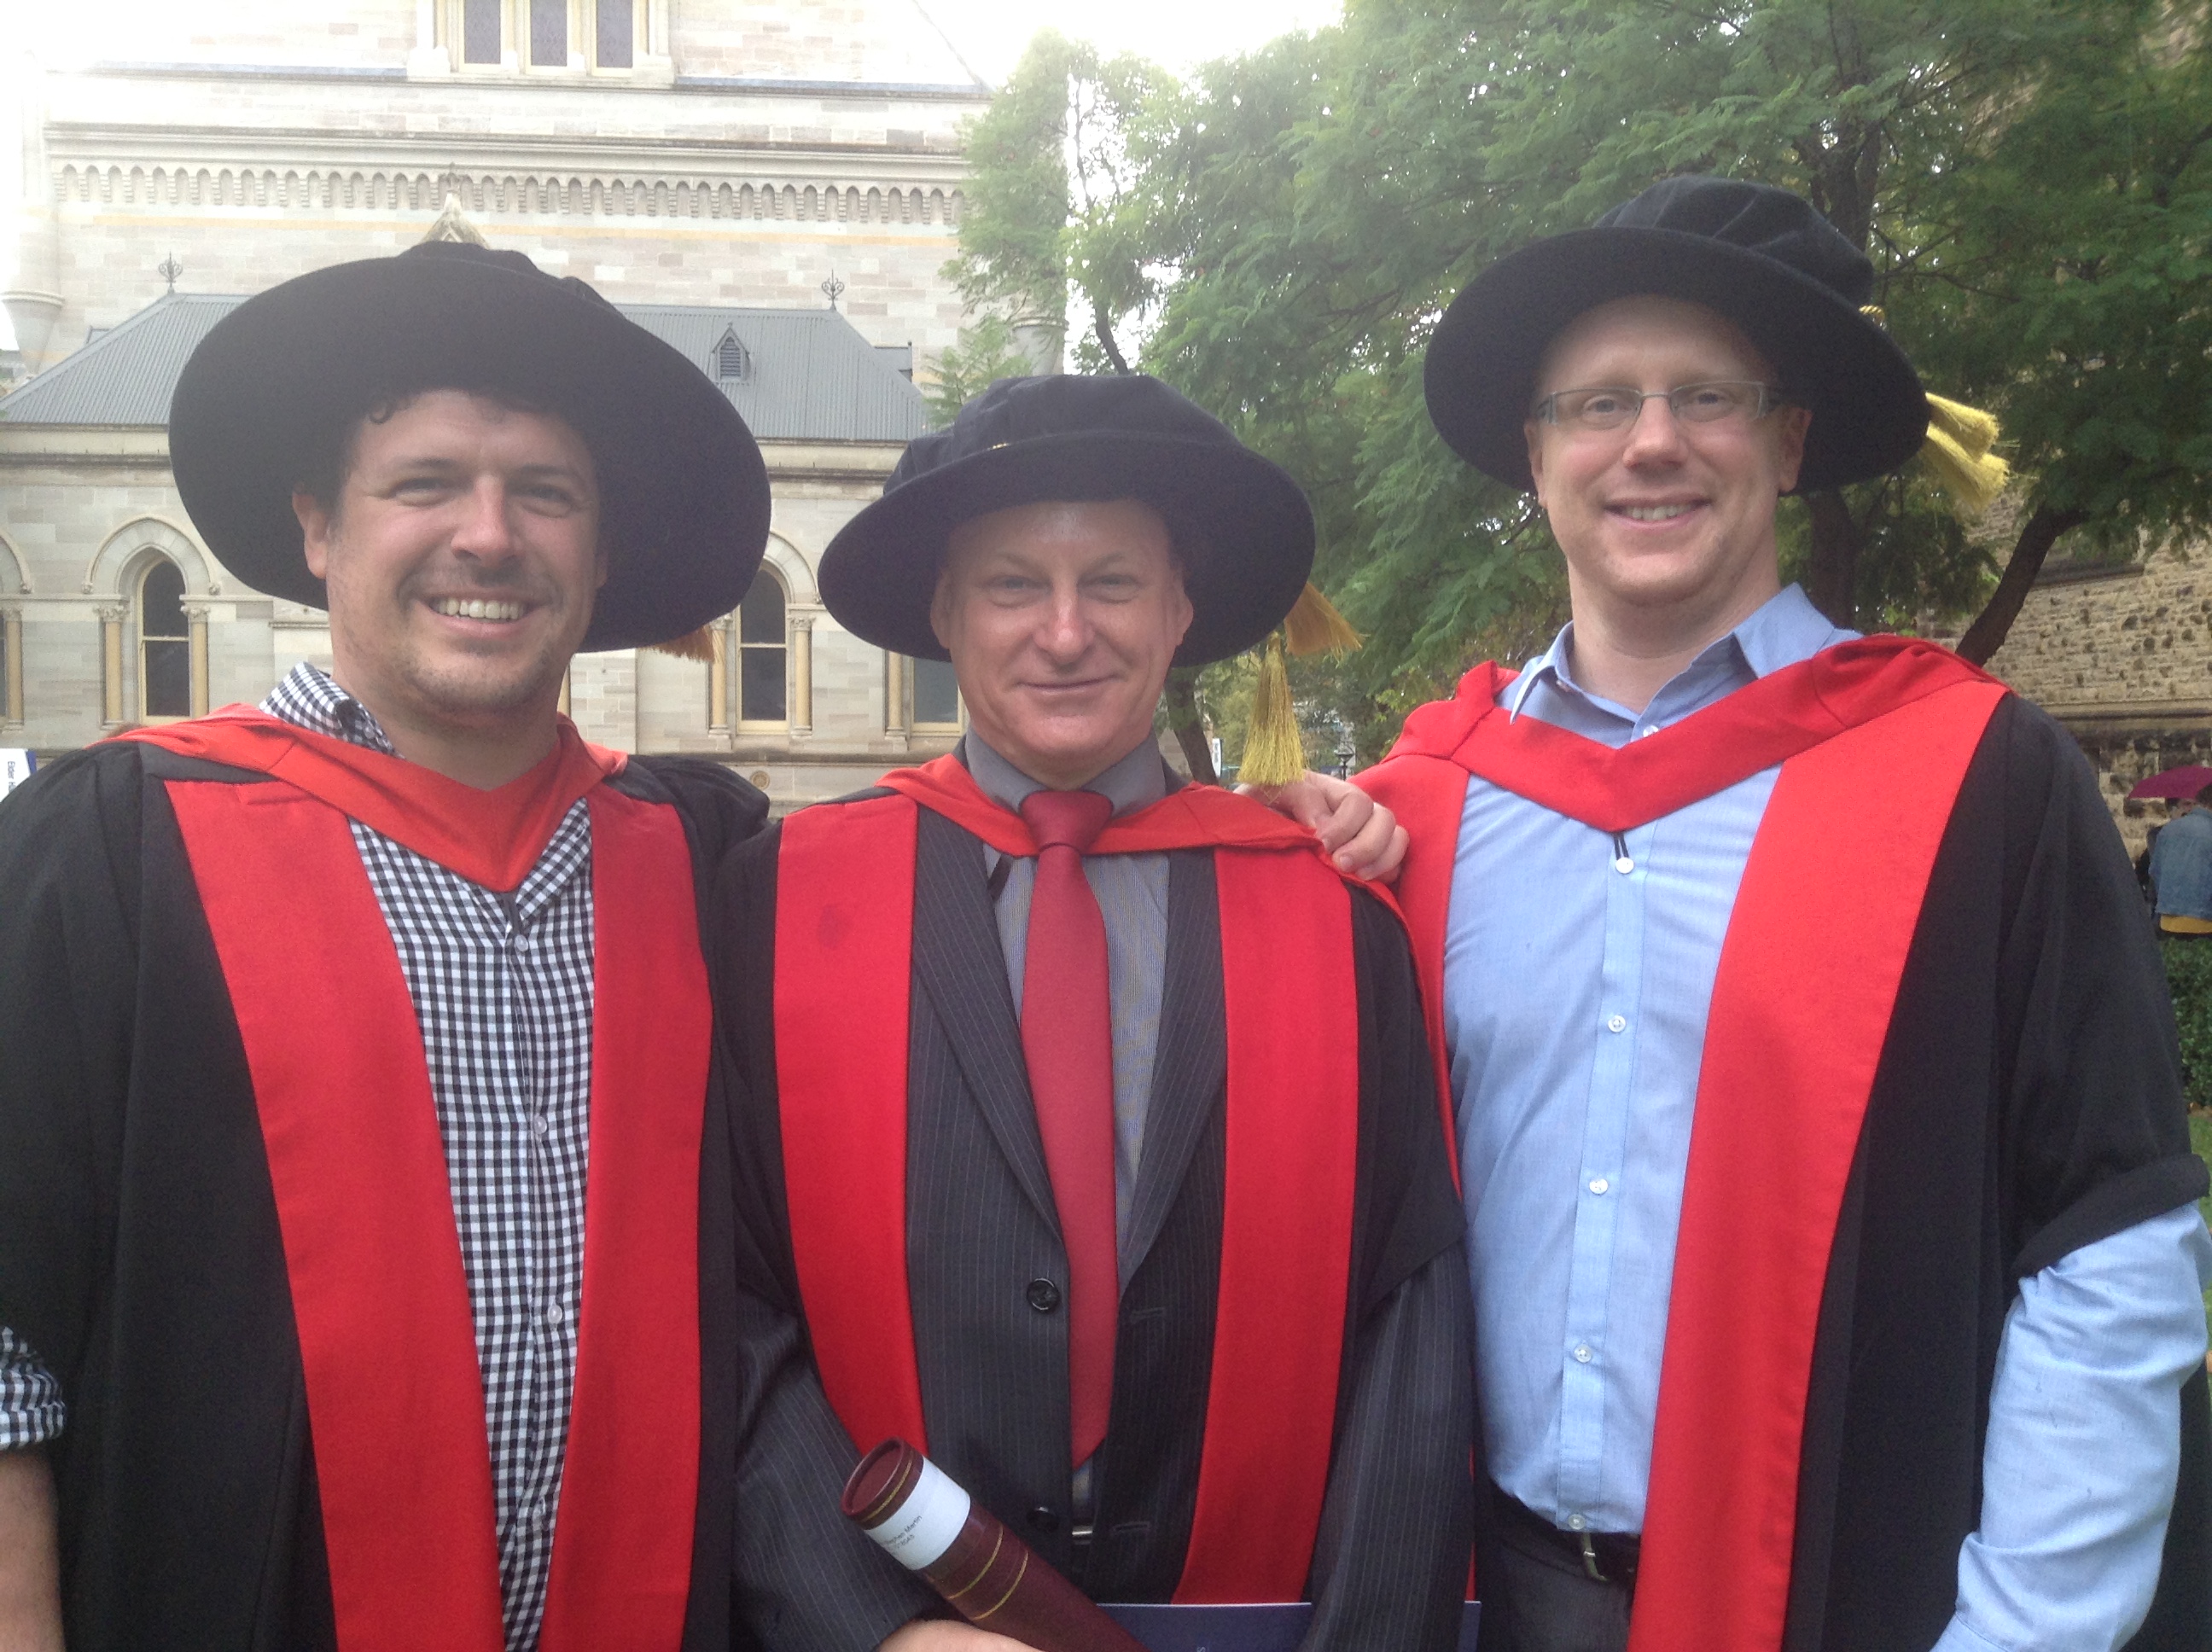
About Me
- Did 1st year science in 1986 \(\rightarrow\) completed 2002-2005 (Genetics)
- BMa.Comp.Sc. (Hons) 2006-2007
- 1988-1991: Elder Conservatorium
- First came across R (1.5.1) analysing two-colour microarrays in Dec 2002
About Me
- PhD 2008-2018
- Normal student: 2008-2011
- Homeless/Couch-surfing: 2012-2013
- Bioinformatics Hub: 2014-2020
- 2020-2022: Dame Roma Mitchell Cancer Research Labs
- 2022-2026: Black Ochre Data Labs
Bioconductor Enthusiast


![]()

- Also developed & maintain
strandcheckR(Hien To)- Helped with
sSNAPPY(Nora Liu) +tadar(Lachlan Baer)
- Helped with
- Currently co-chair of Community Advisory Board
- Leading BiocAsia Working Group


The PROPHECY Study
The PROPHECY Study
The PROPHECY Study

The PROPHECY Study
- A key design element \(\rightarrow\) all research is community led, not researcher led
- Prof Alex Brown spent 5 years consulting with SA communities first
- Strong Indigenous Data Sovereignty Principles
- Strict data management protocols
- High demand for clear documentation

Clickbait Time
Is large cohort transcriptomics just scRNA without the zero counts?

Sequencing Considerations
- Whole Blood from participants \(\implies\) incredibly valuable resource
- Trying to to get everything as ‘right’ as possible \(\implies\) no second chances
- 13x96 well plates were planned for & paid before I joined \(\implies\) N = 1248
- Subset of 93 participants already sequenced by the El Osta group
- Focus on Chronic Kidney Disease (CKD) + Diabetes (T2D)
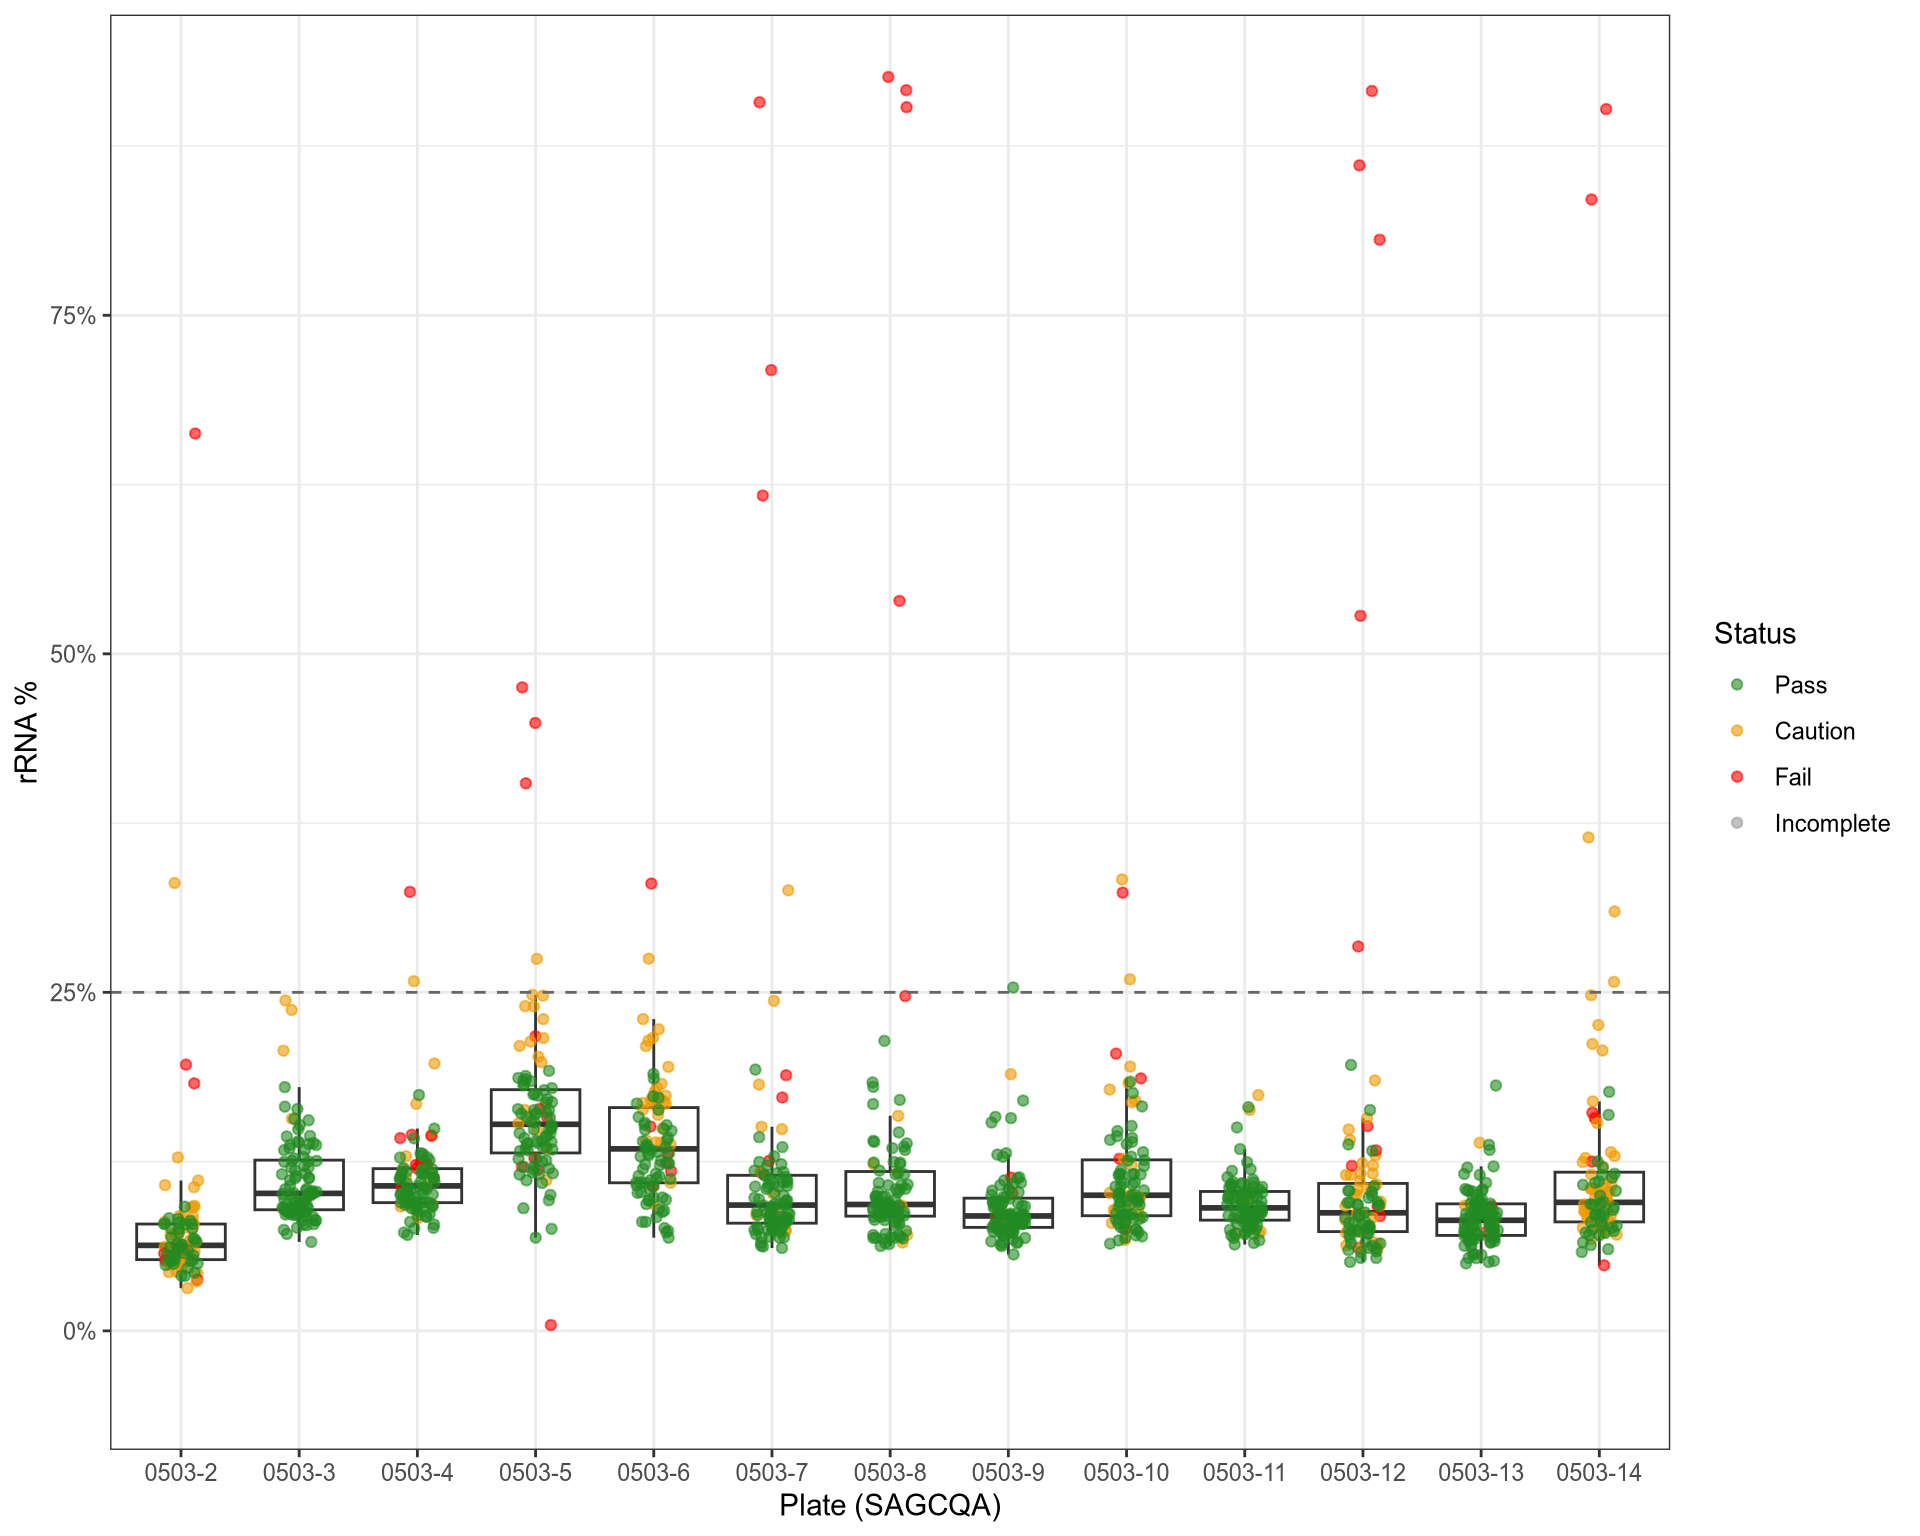
- Total RNA \(\implies\) rRNA Depleted but not hbRNA depleted
- hbRNA was 30-50% of library
- rRNA consistently below 20% (mostly below 10%)
- Pilot study compared polyA with totalRNA (rRNA + hbRNA depleted)
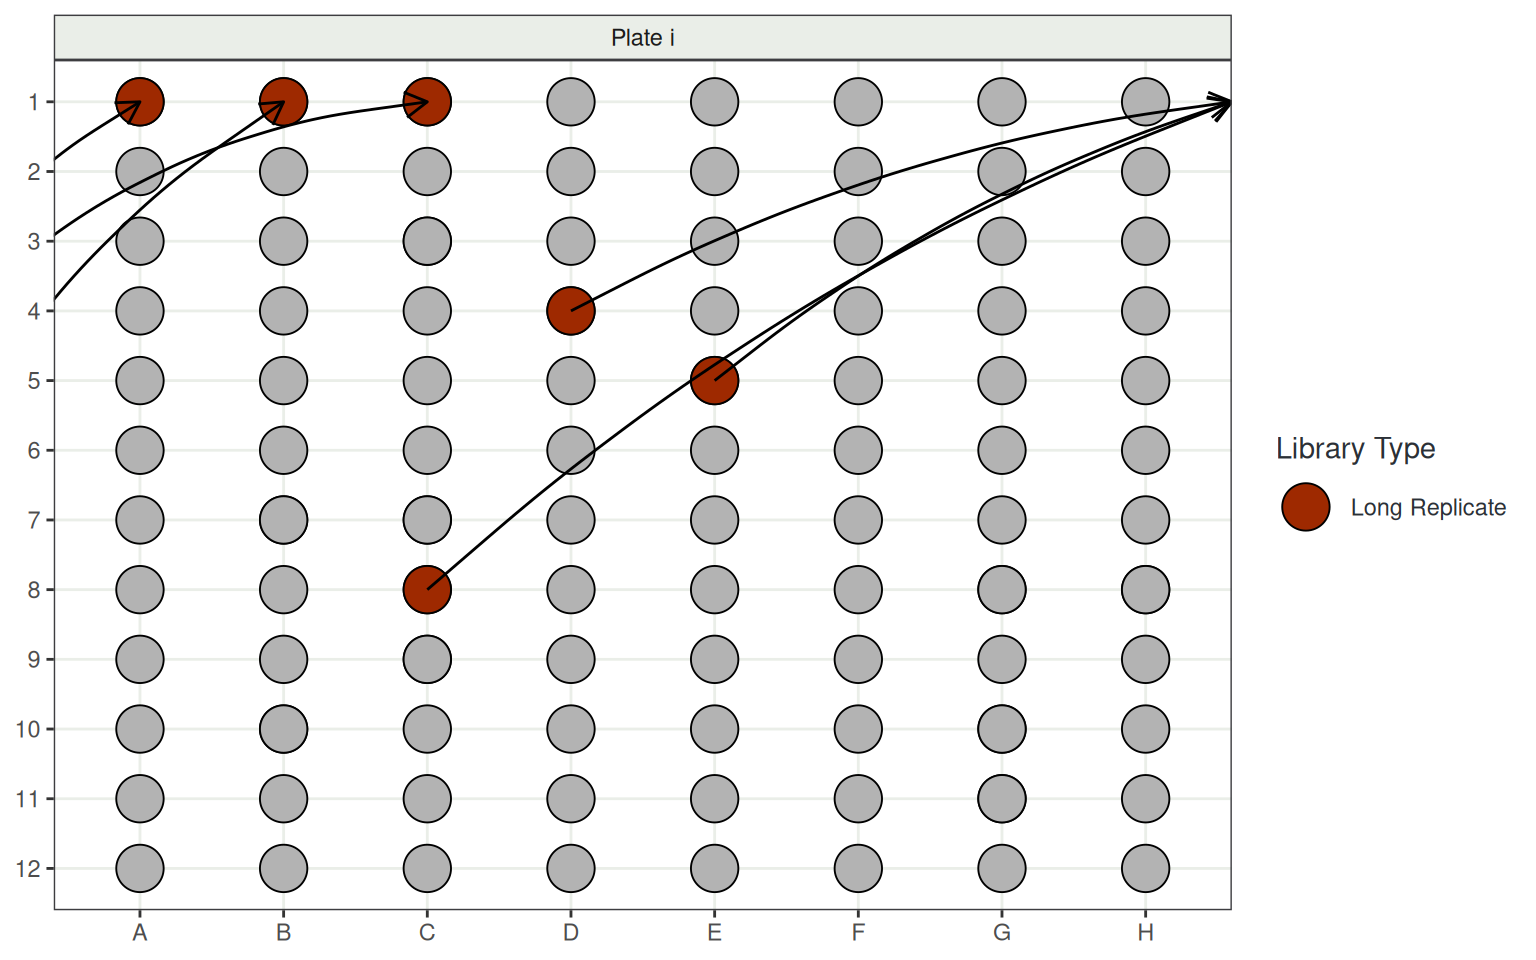
Experimental Design
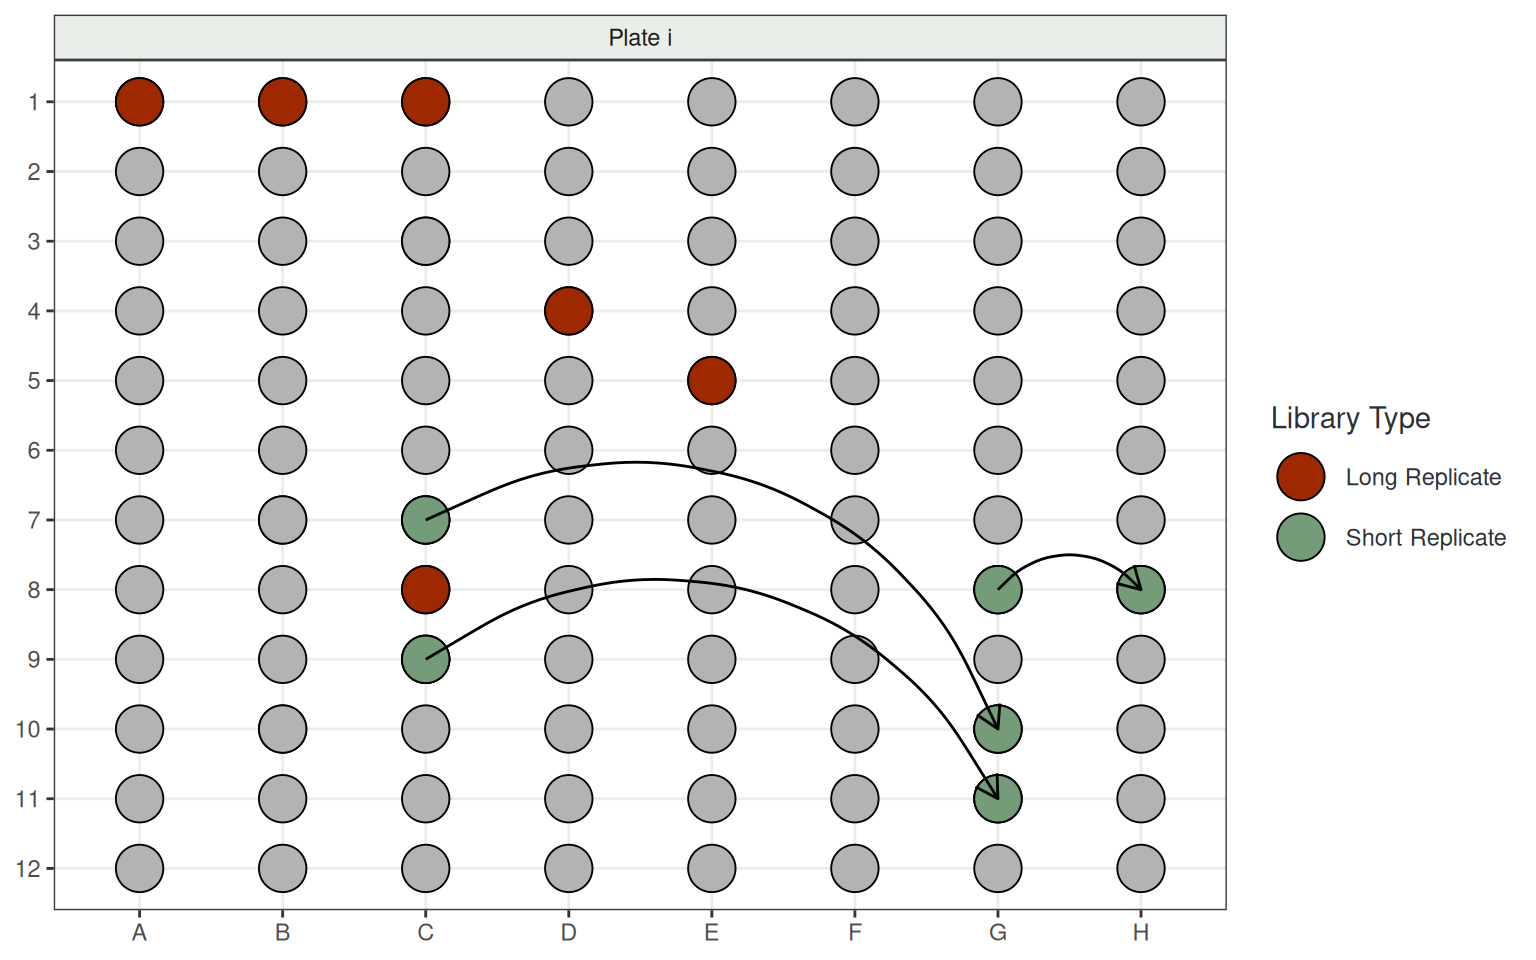
- Plates include:
- 6 Long Replicates to straddle consecutive plates
- 6 Short Replicates within plates
Experimental Design
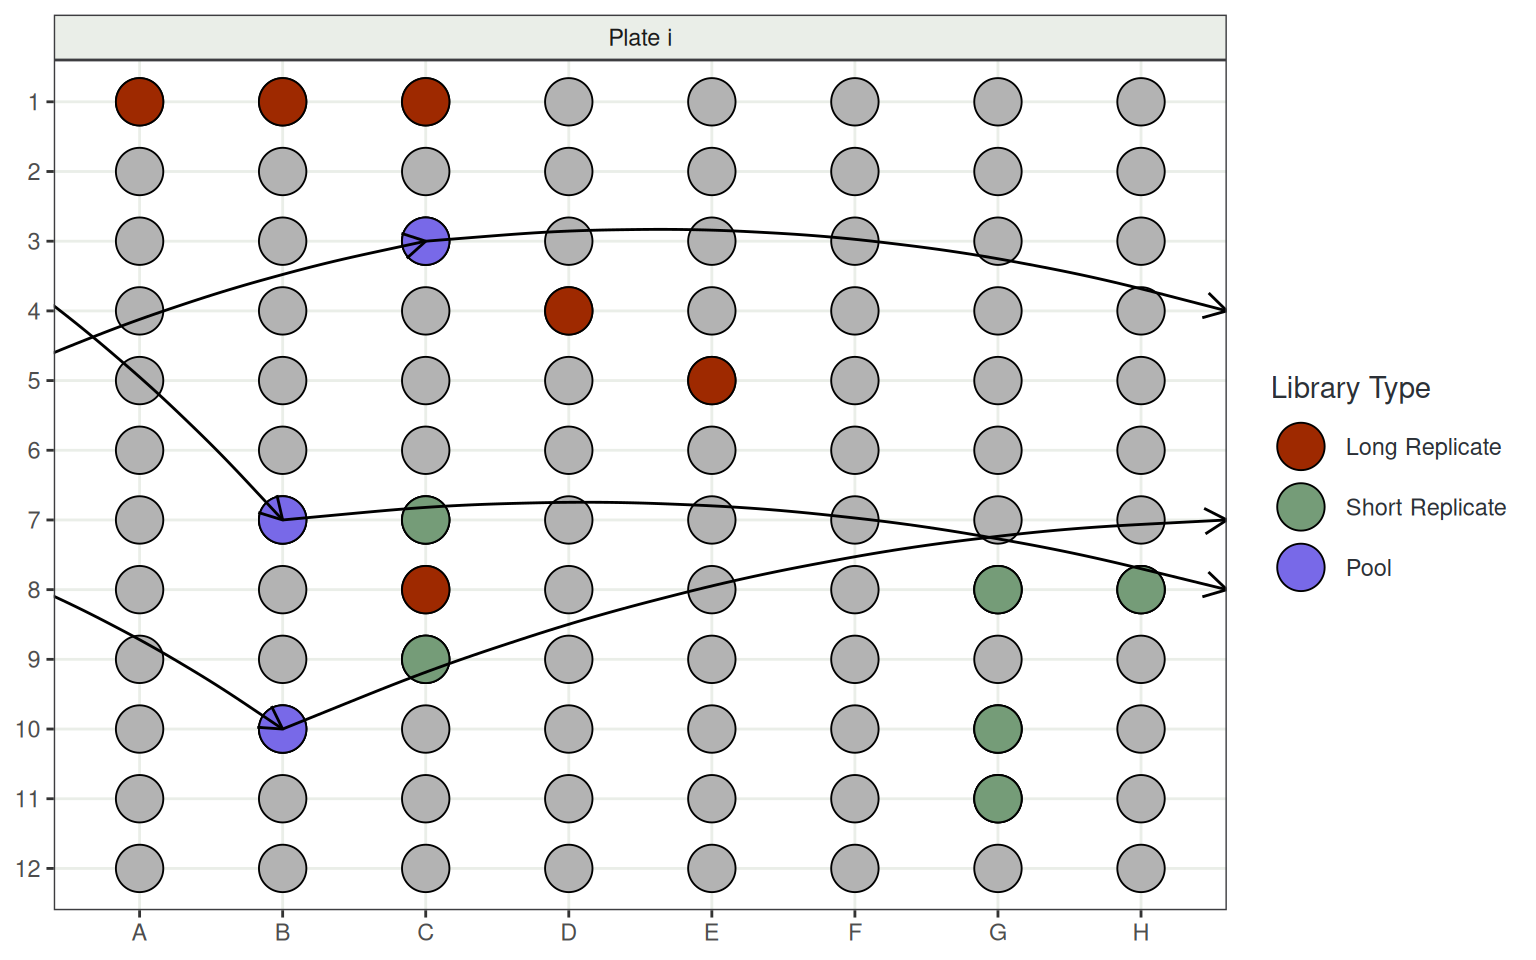
- Plates include:
- 6 Long Replicates to straddle consecutive plates
- 6 Short Replicates within plates
- 3 distinct pools across all 13 plates
- 87 Participants \(\implies\) 1,134 total
Data Processing Workflow
- Data processing written in
nextflow- Dr Alastair Ludington & Holly Massacci
- Run as every plate came in
- Produced a set of plate-level QC reports
- Threw everything at it:
fastp,RSeQC,samtools stats, all log files etc - Forgot to include
strandcheckR(To and Pederson 2019) \(\rightarrow\) supplementary pipeline
- Threw everything at it:
- Manually checked every plate for Pass/Fail/Caution
- Thinking about which libraries to resequence


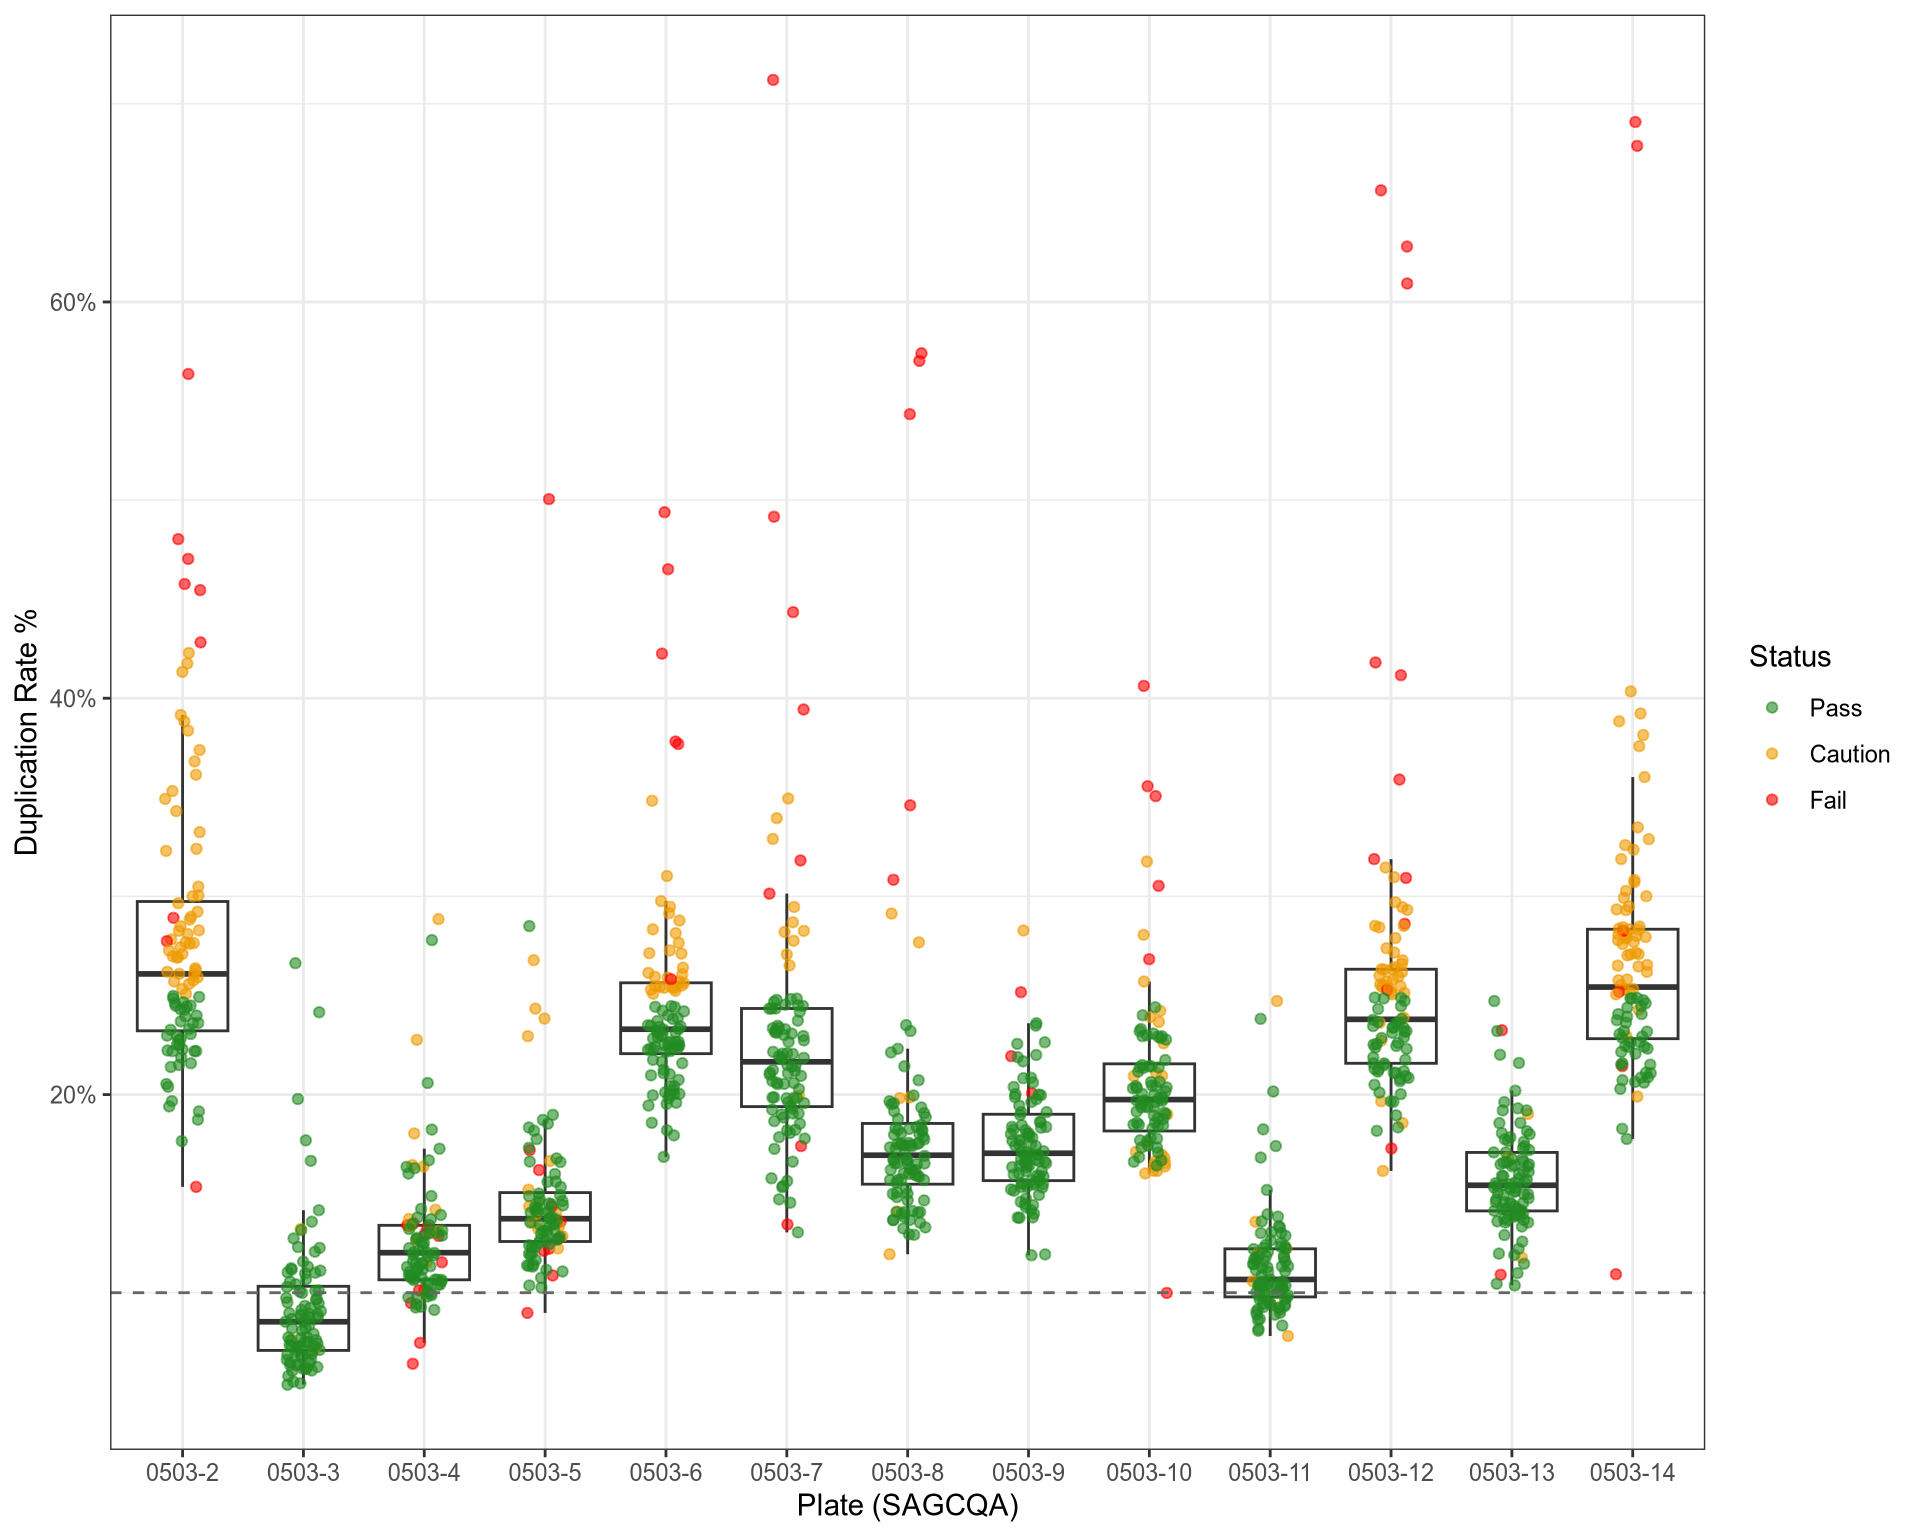
QC: Duplication Rates
QC: rRNA Content
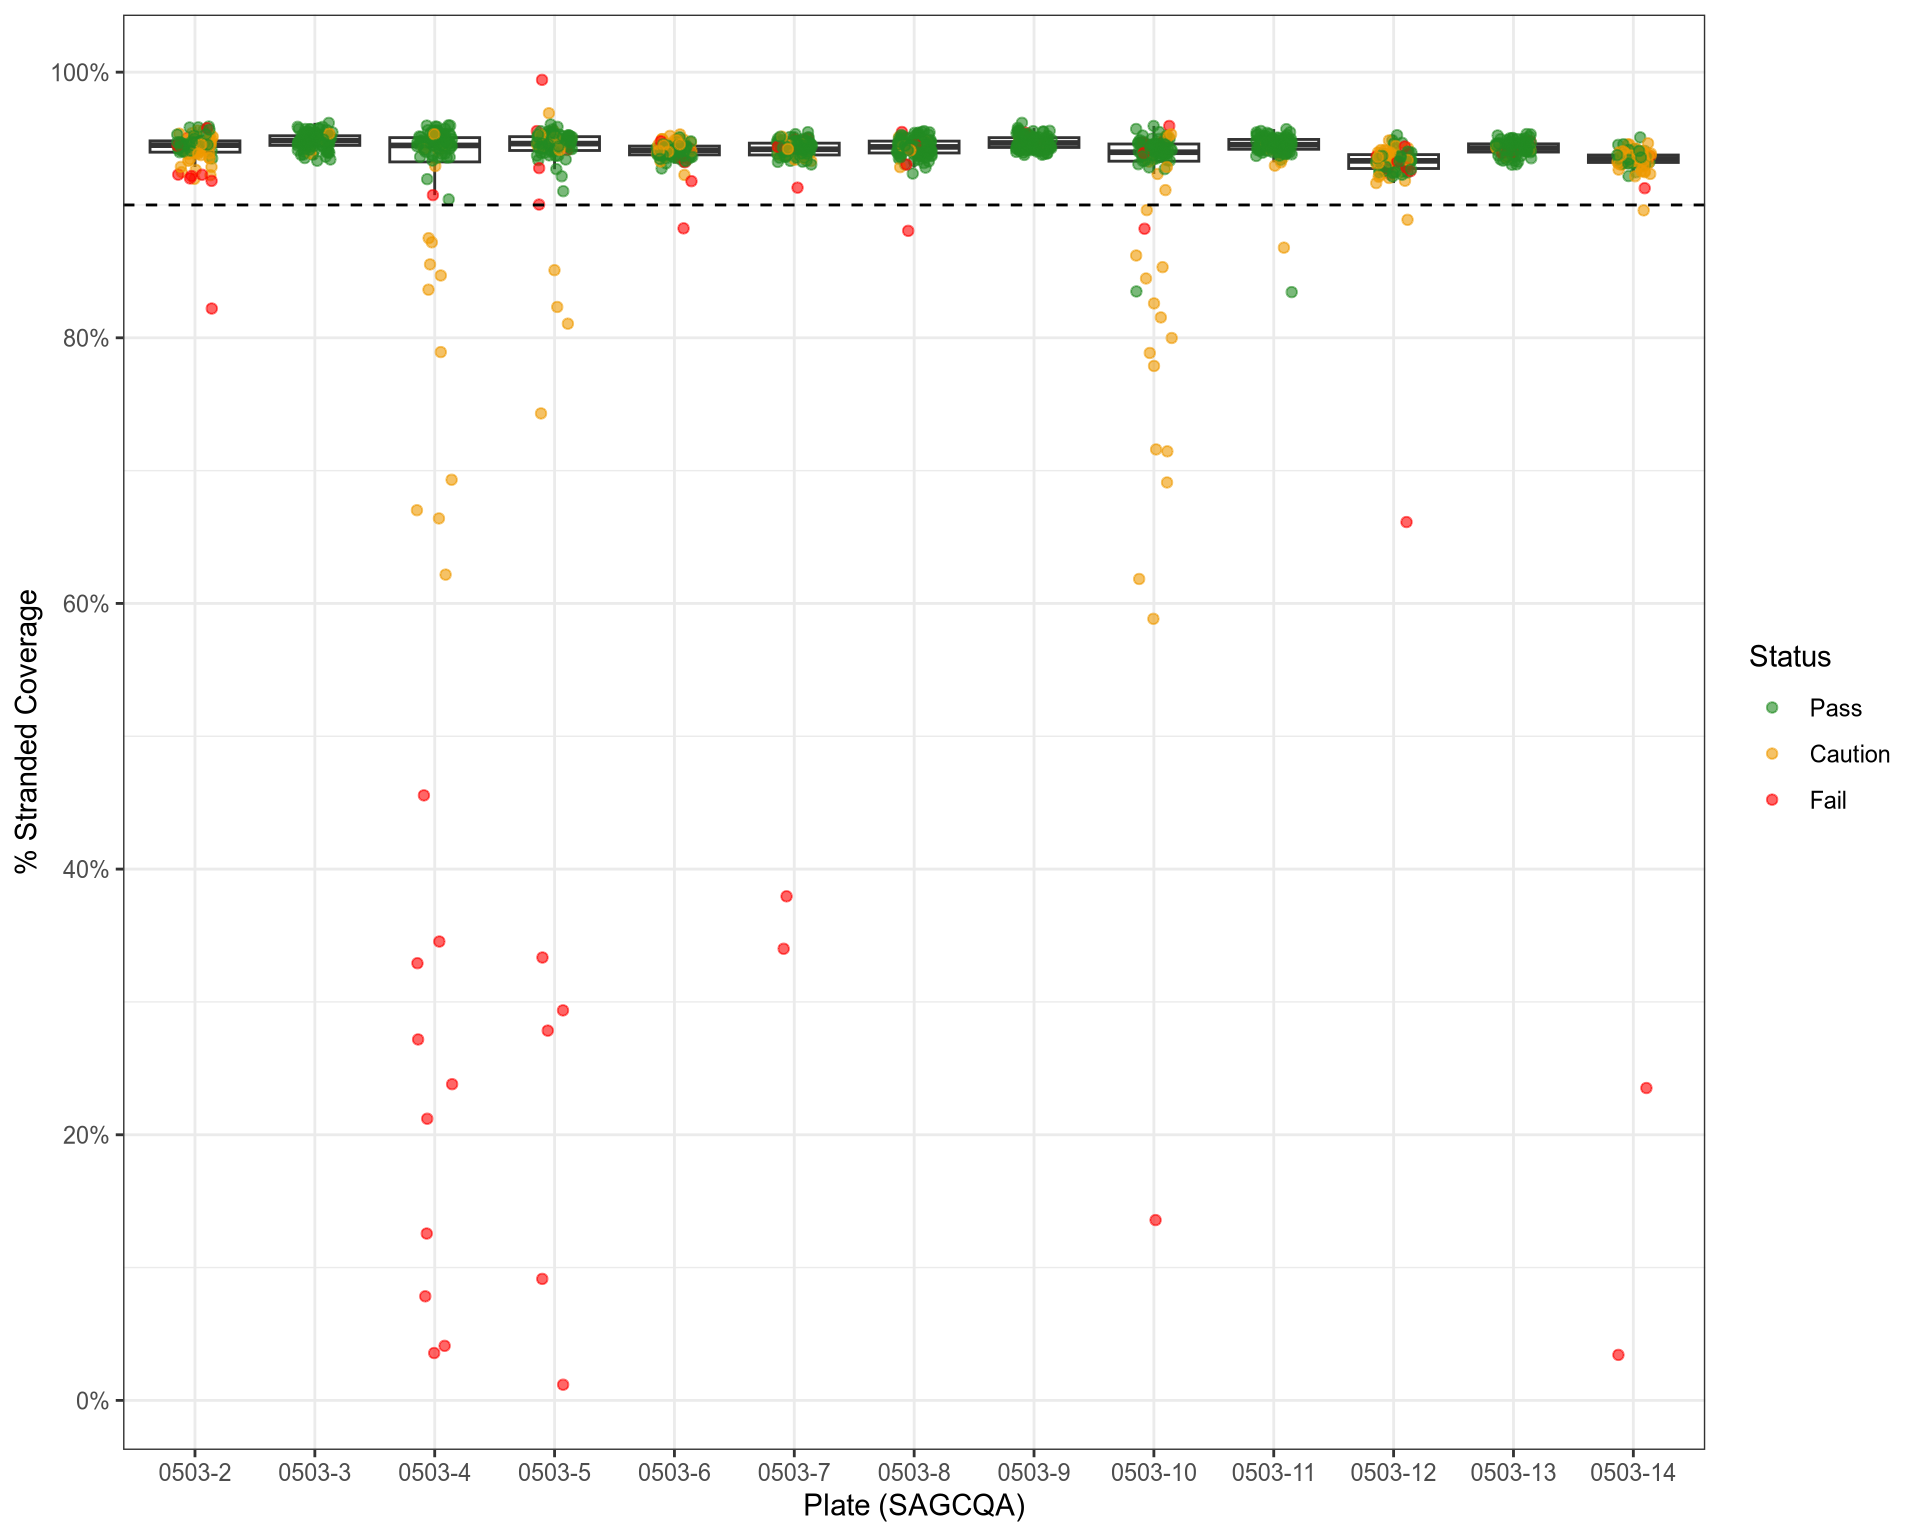
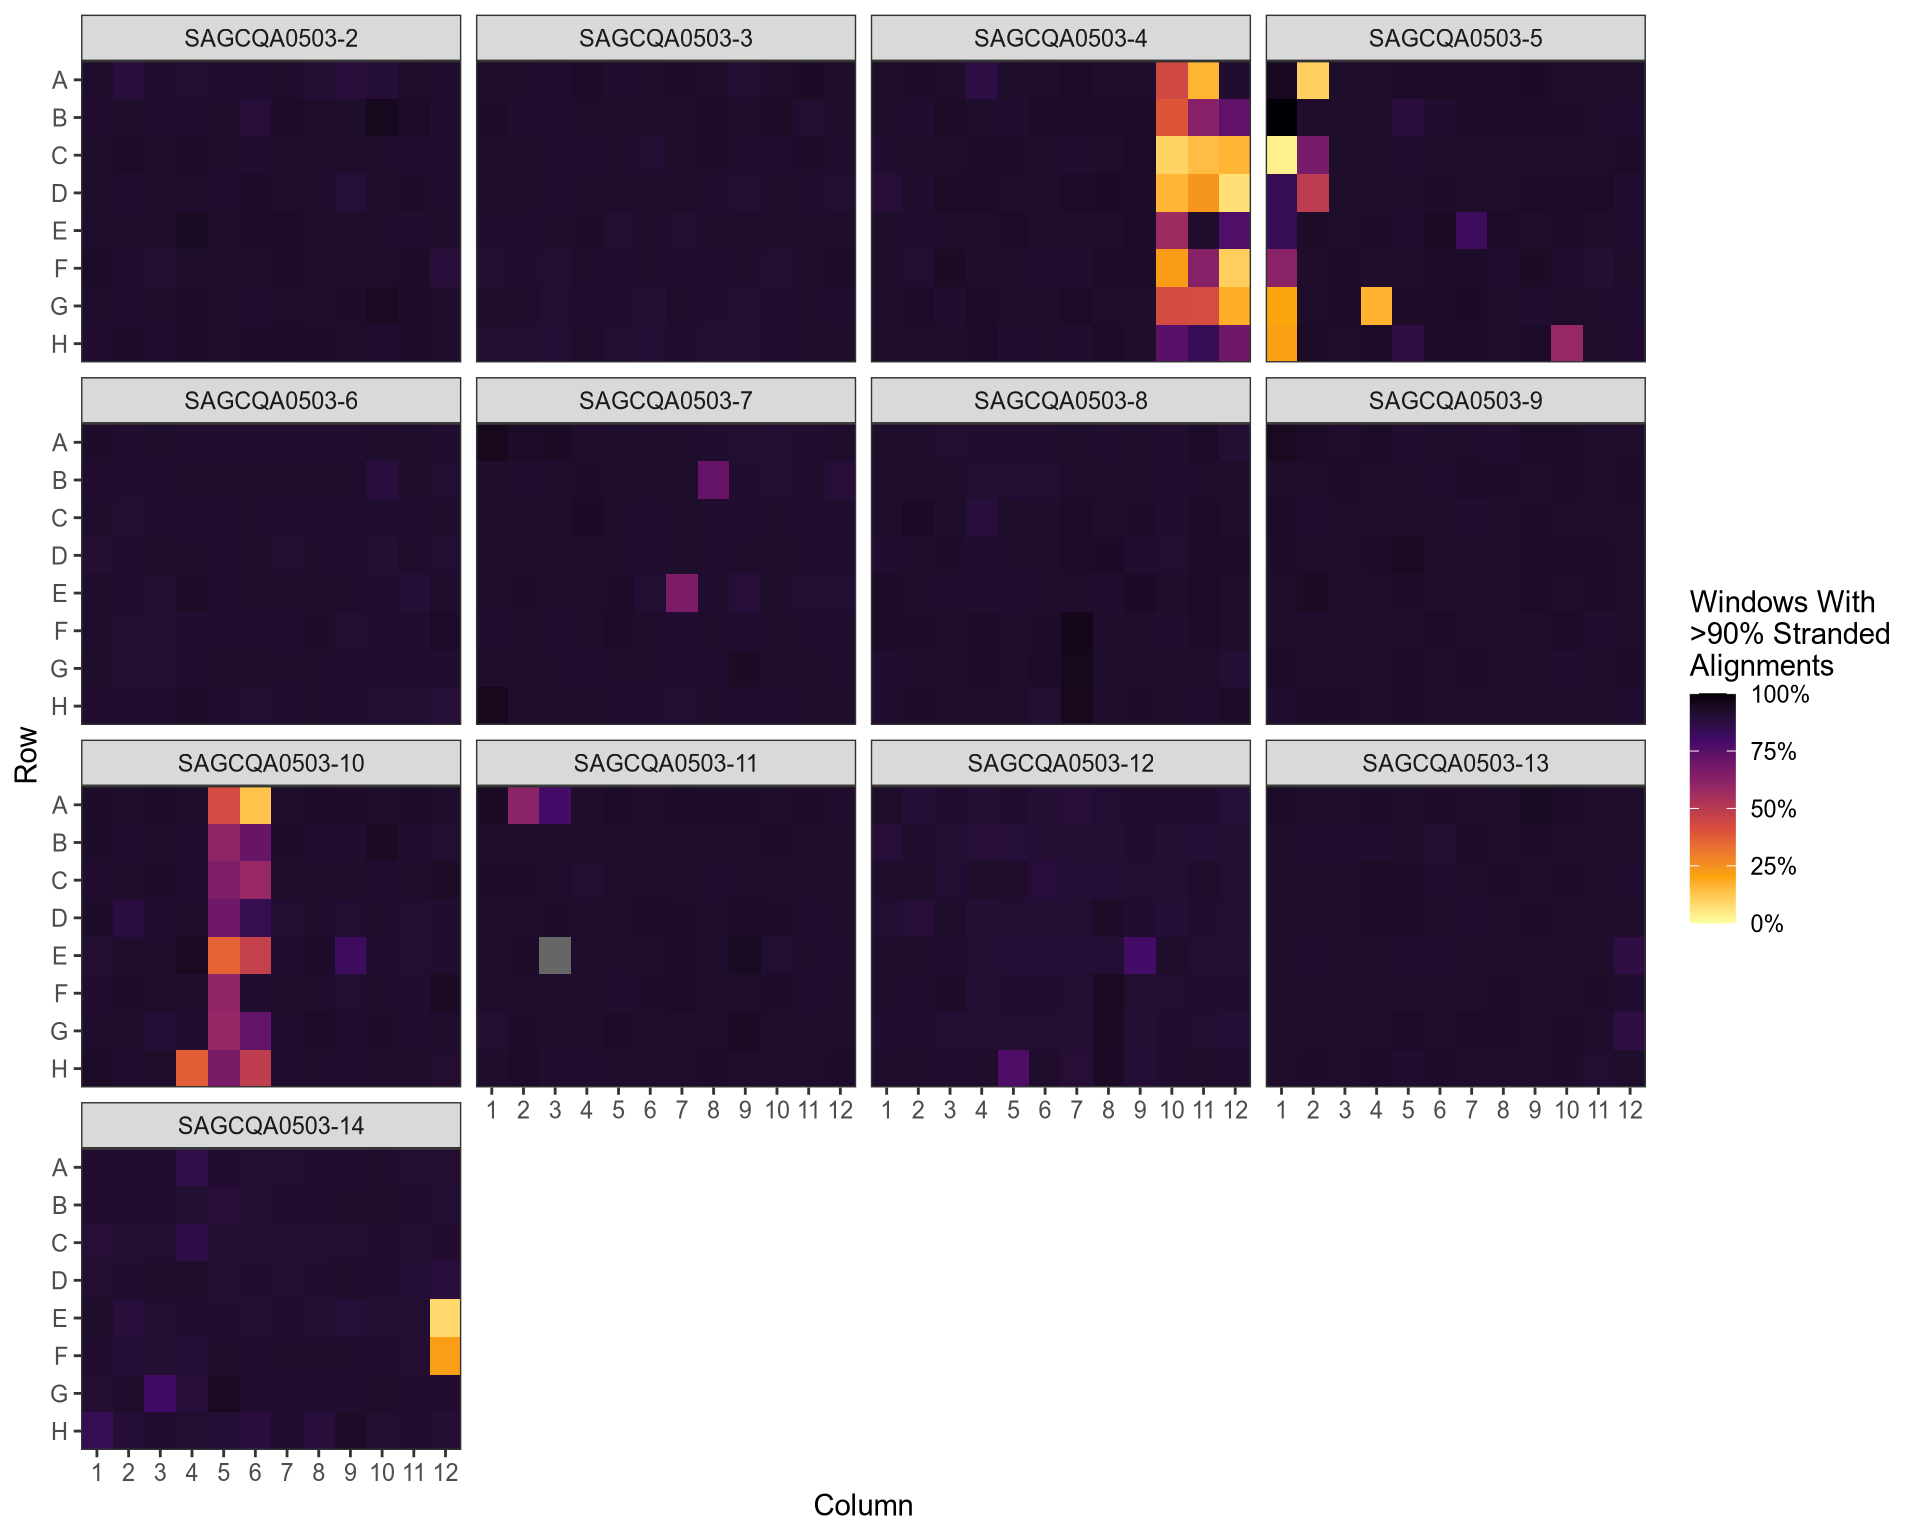
QC: Strandedness of Alignments
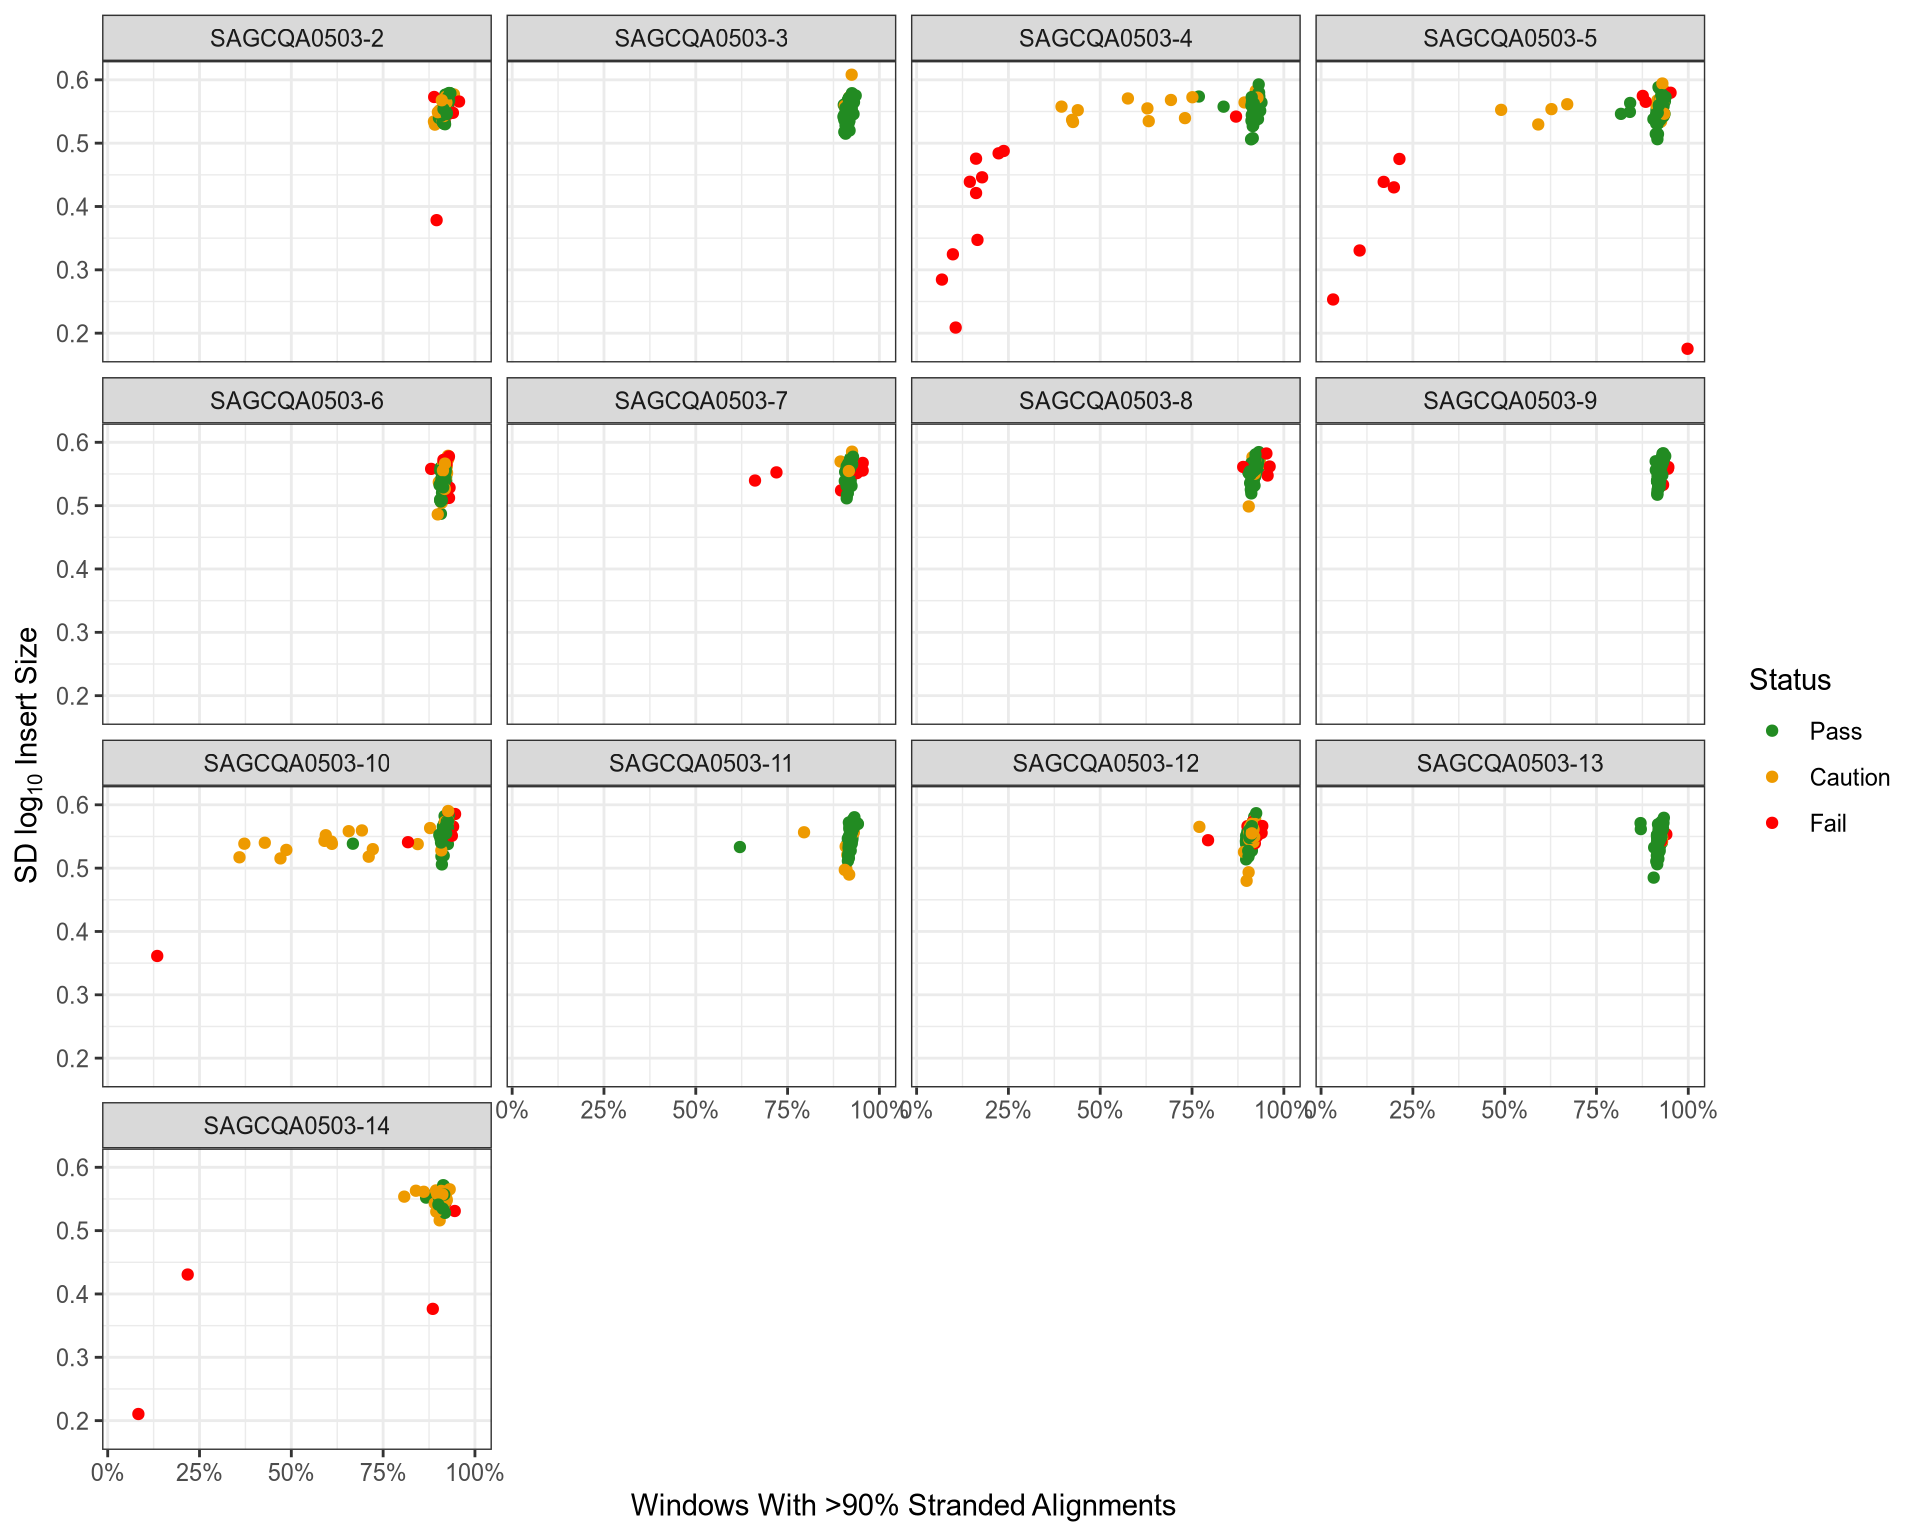
QC: Strandedness Vs Insert Size Variability
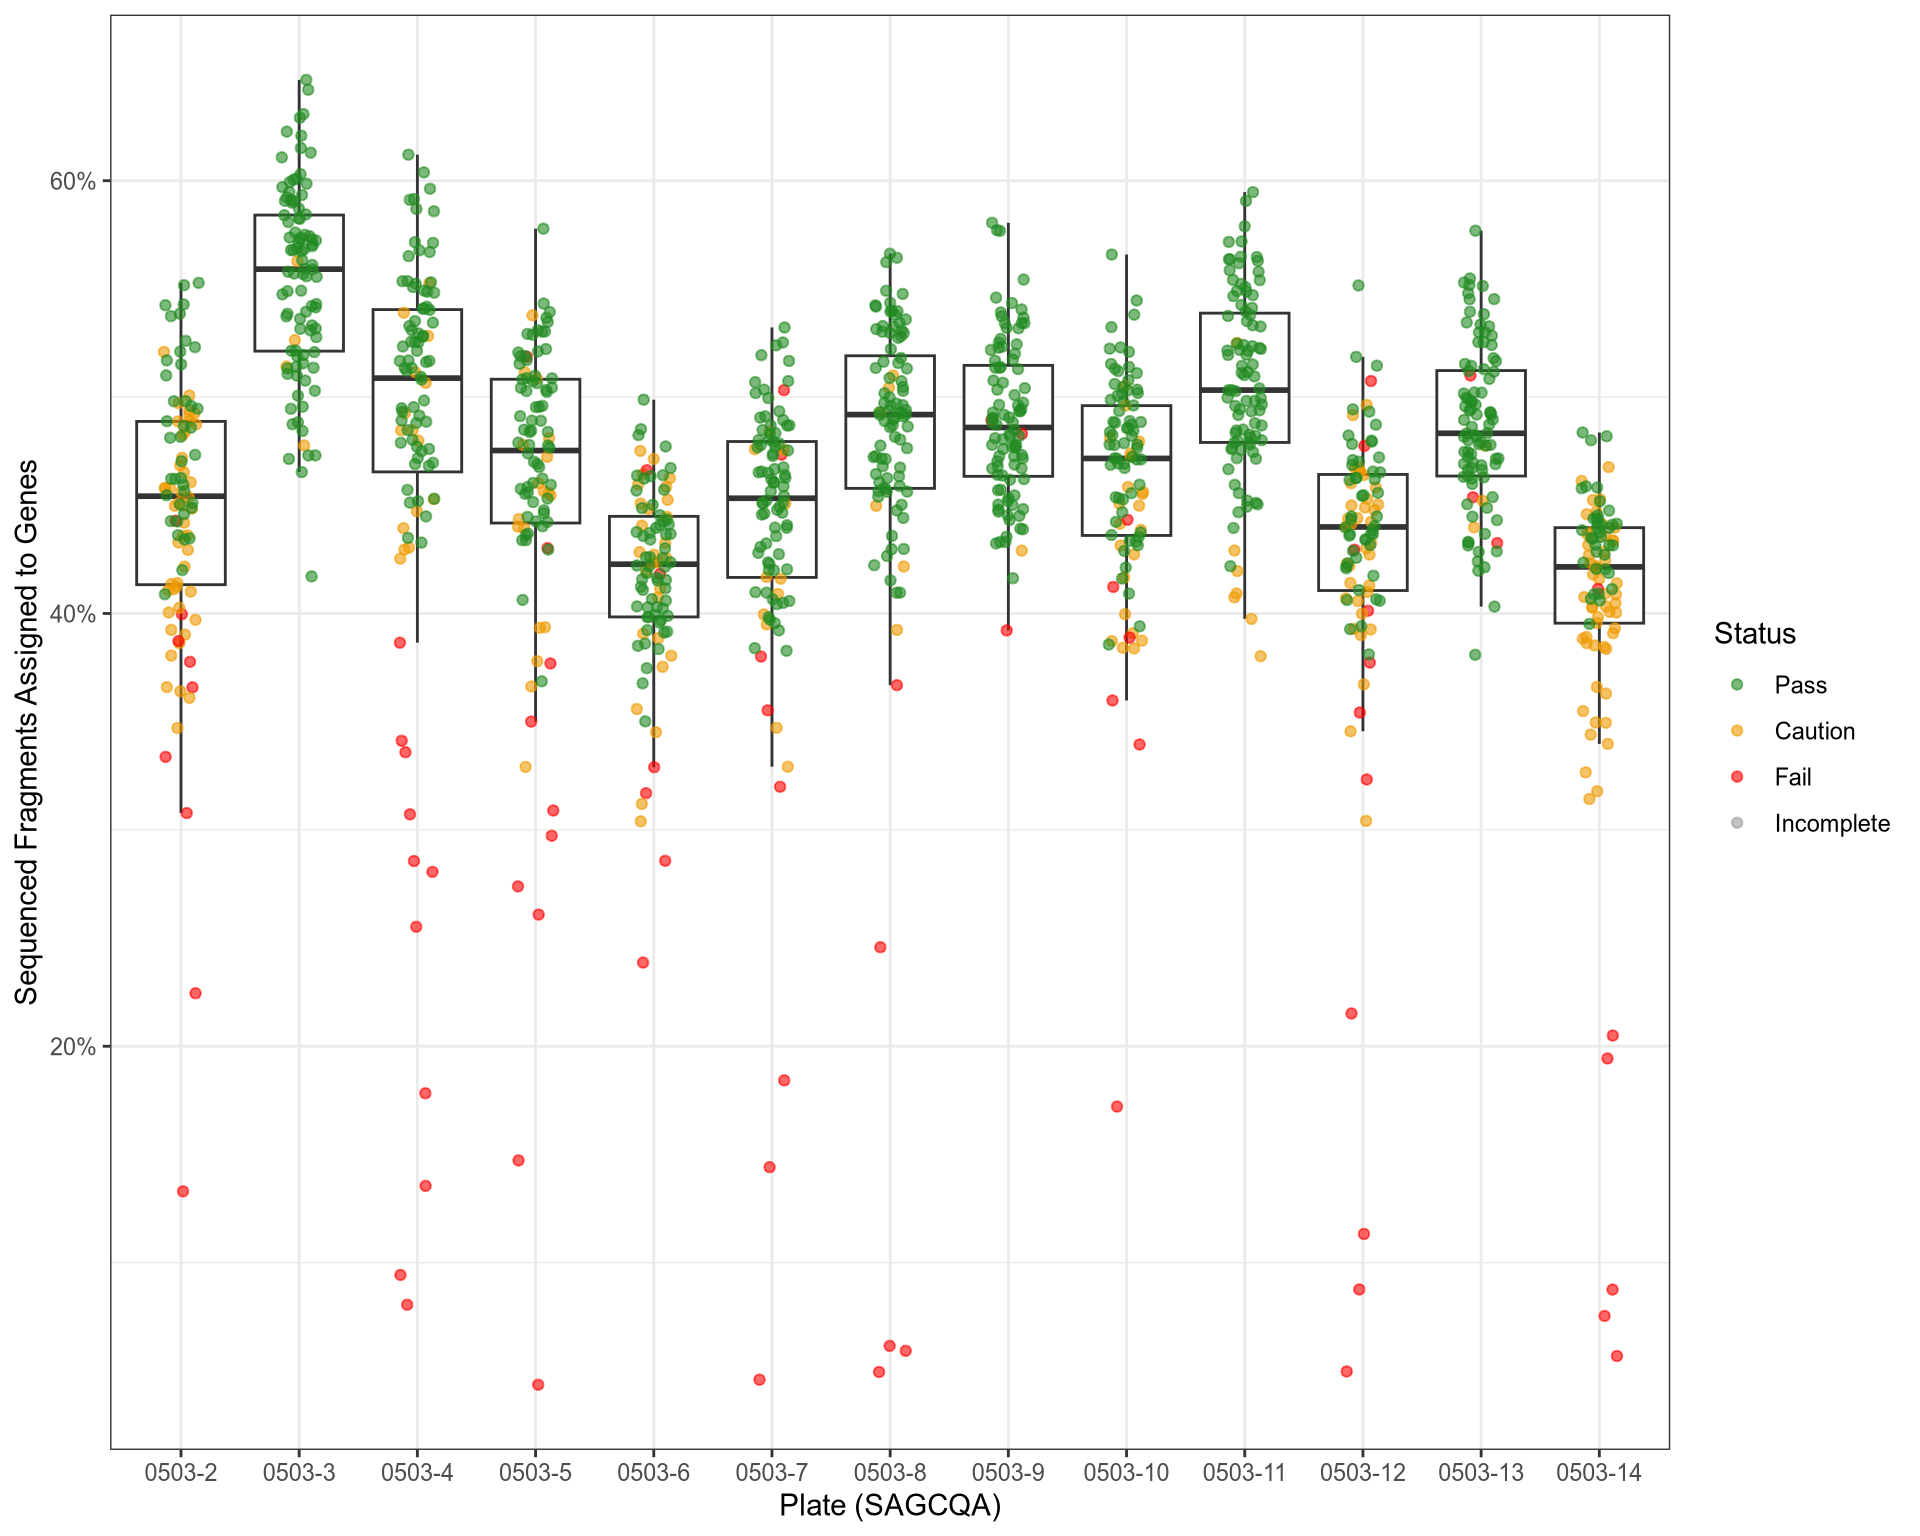
QC: % Of Sequenced Reads Assigned to Genes
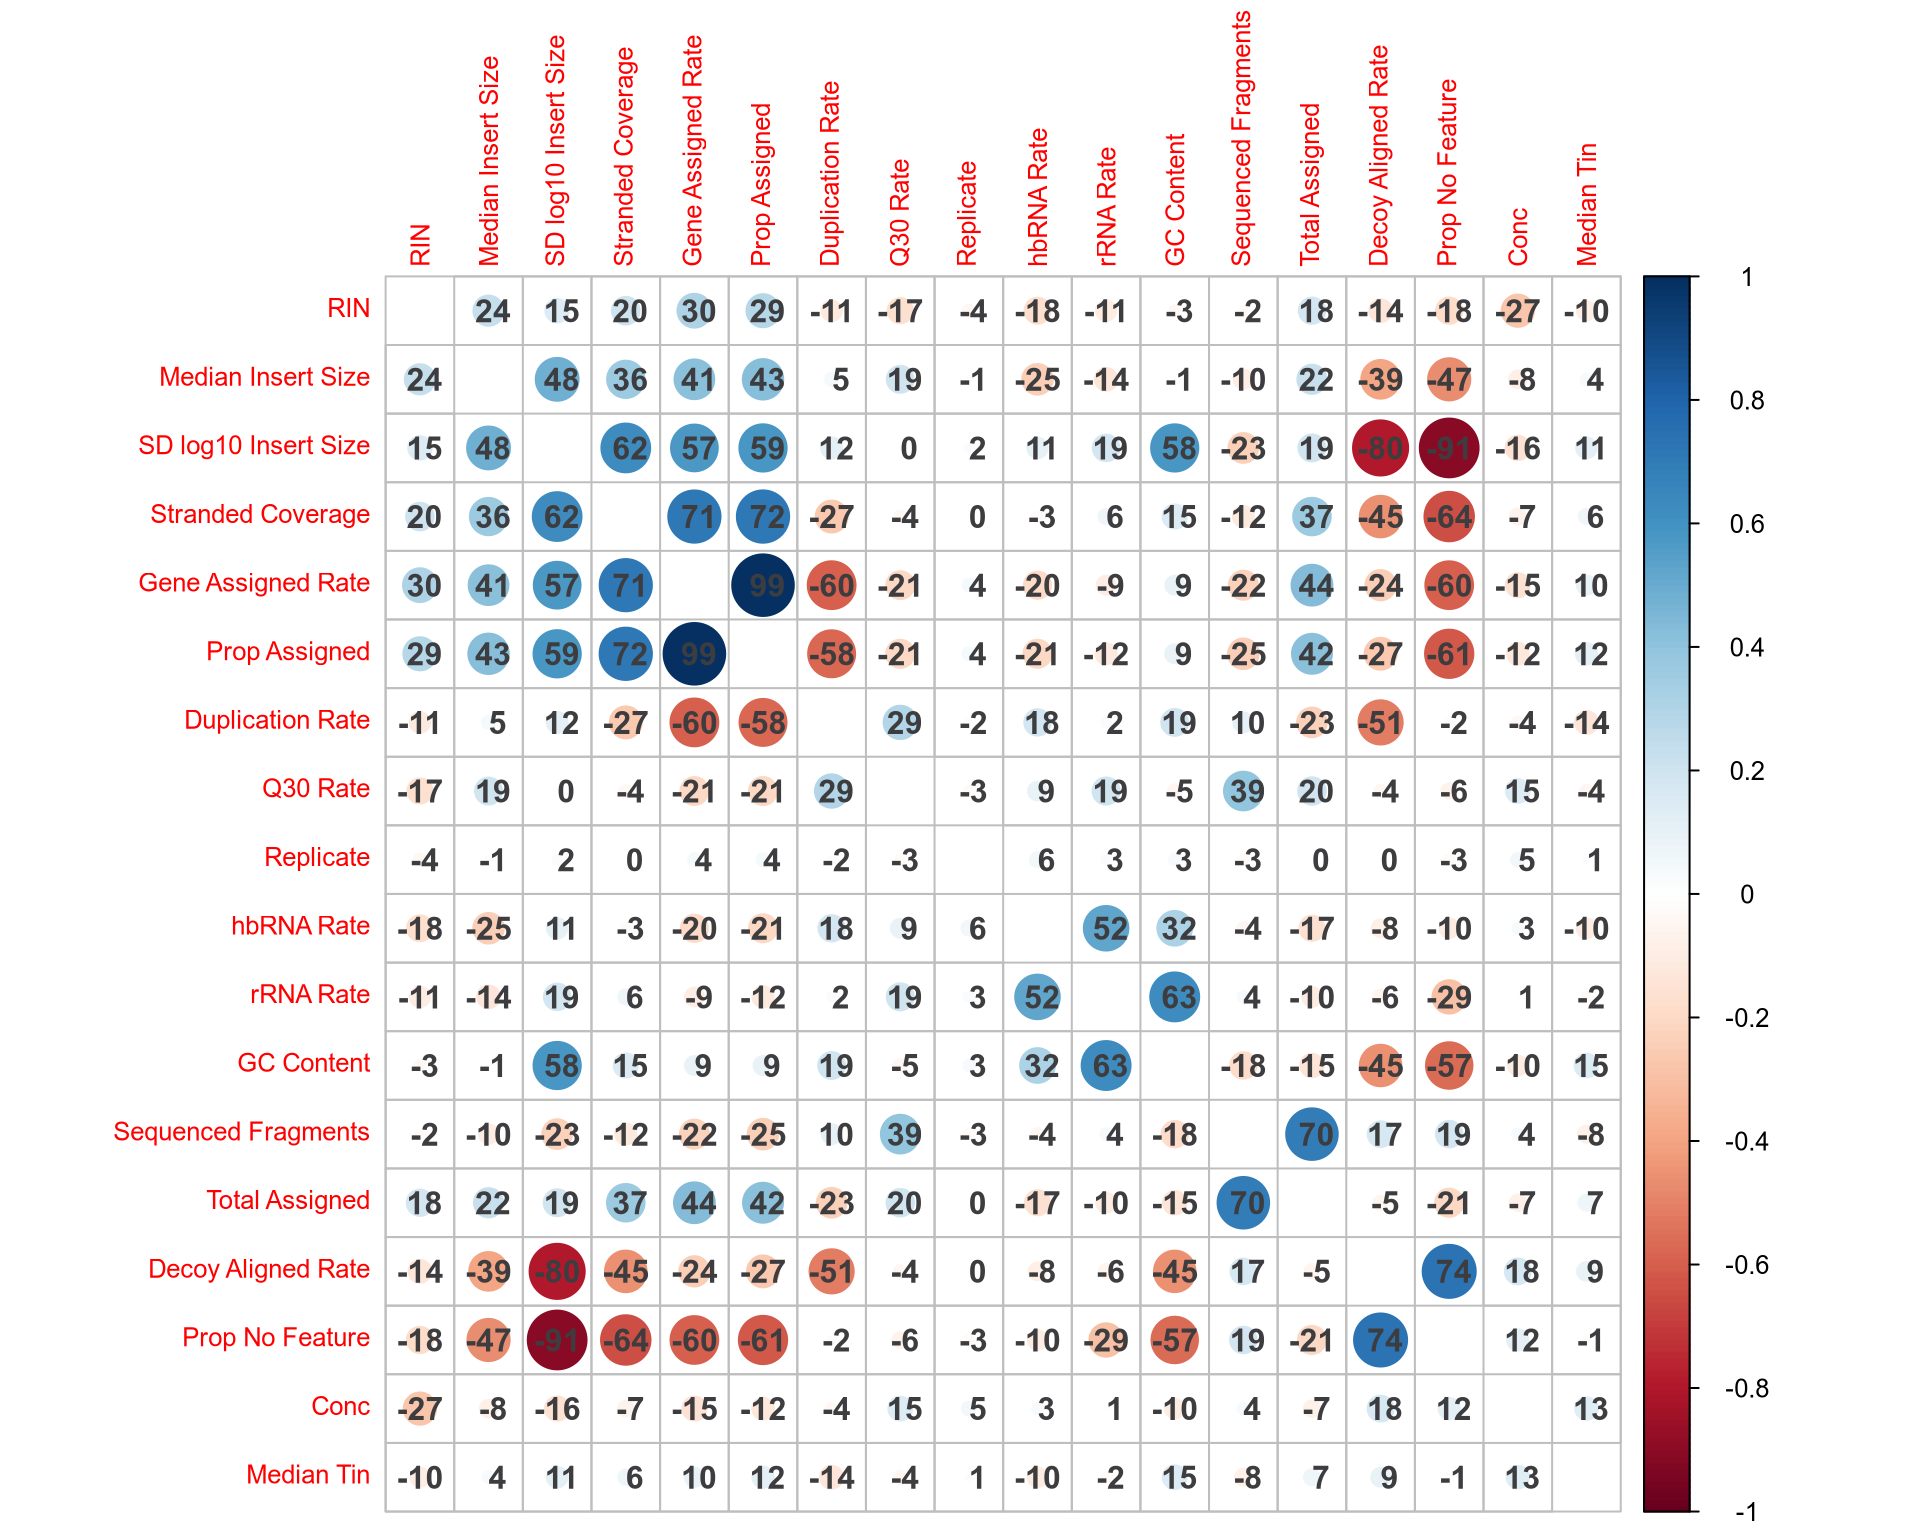
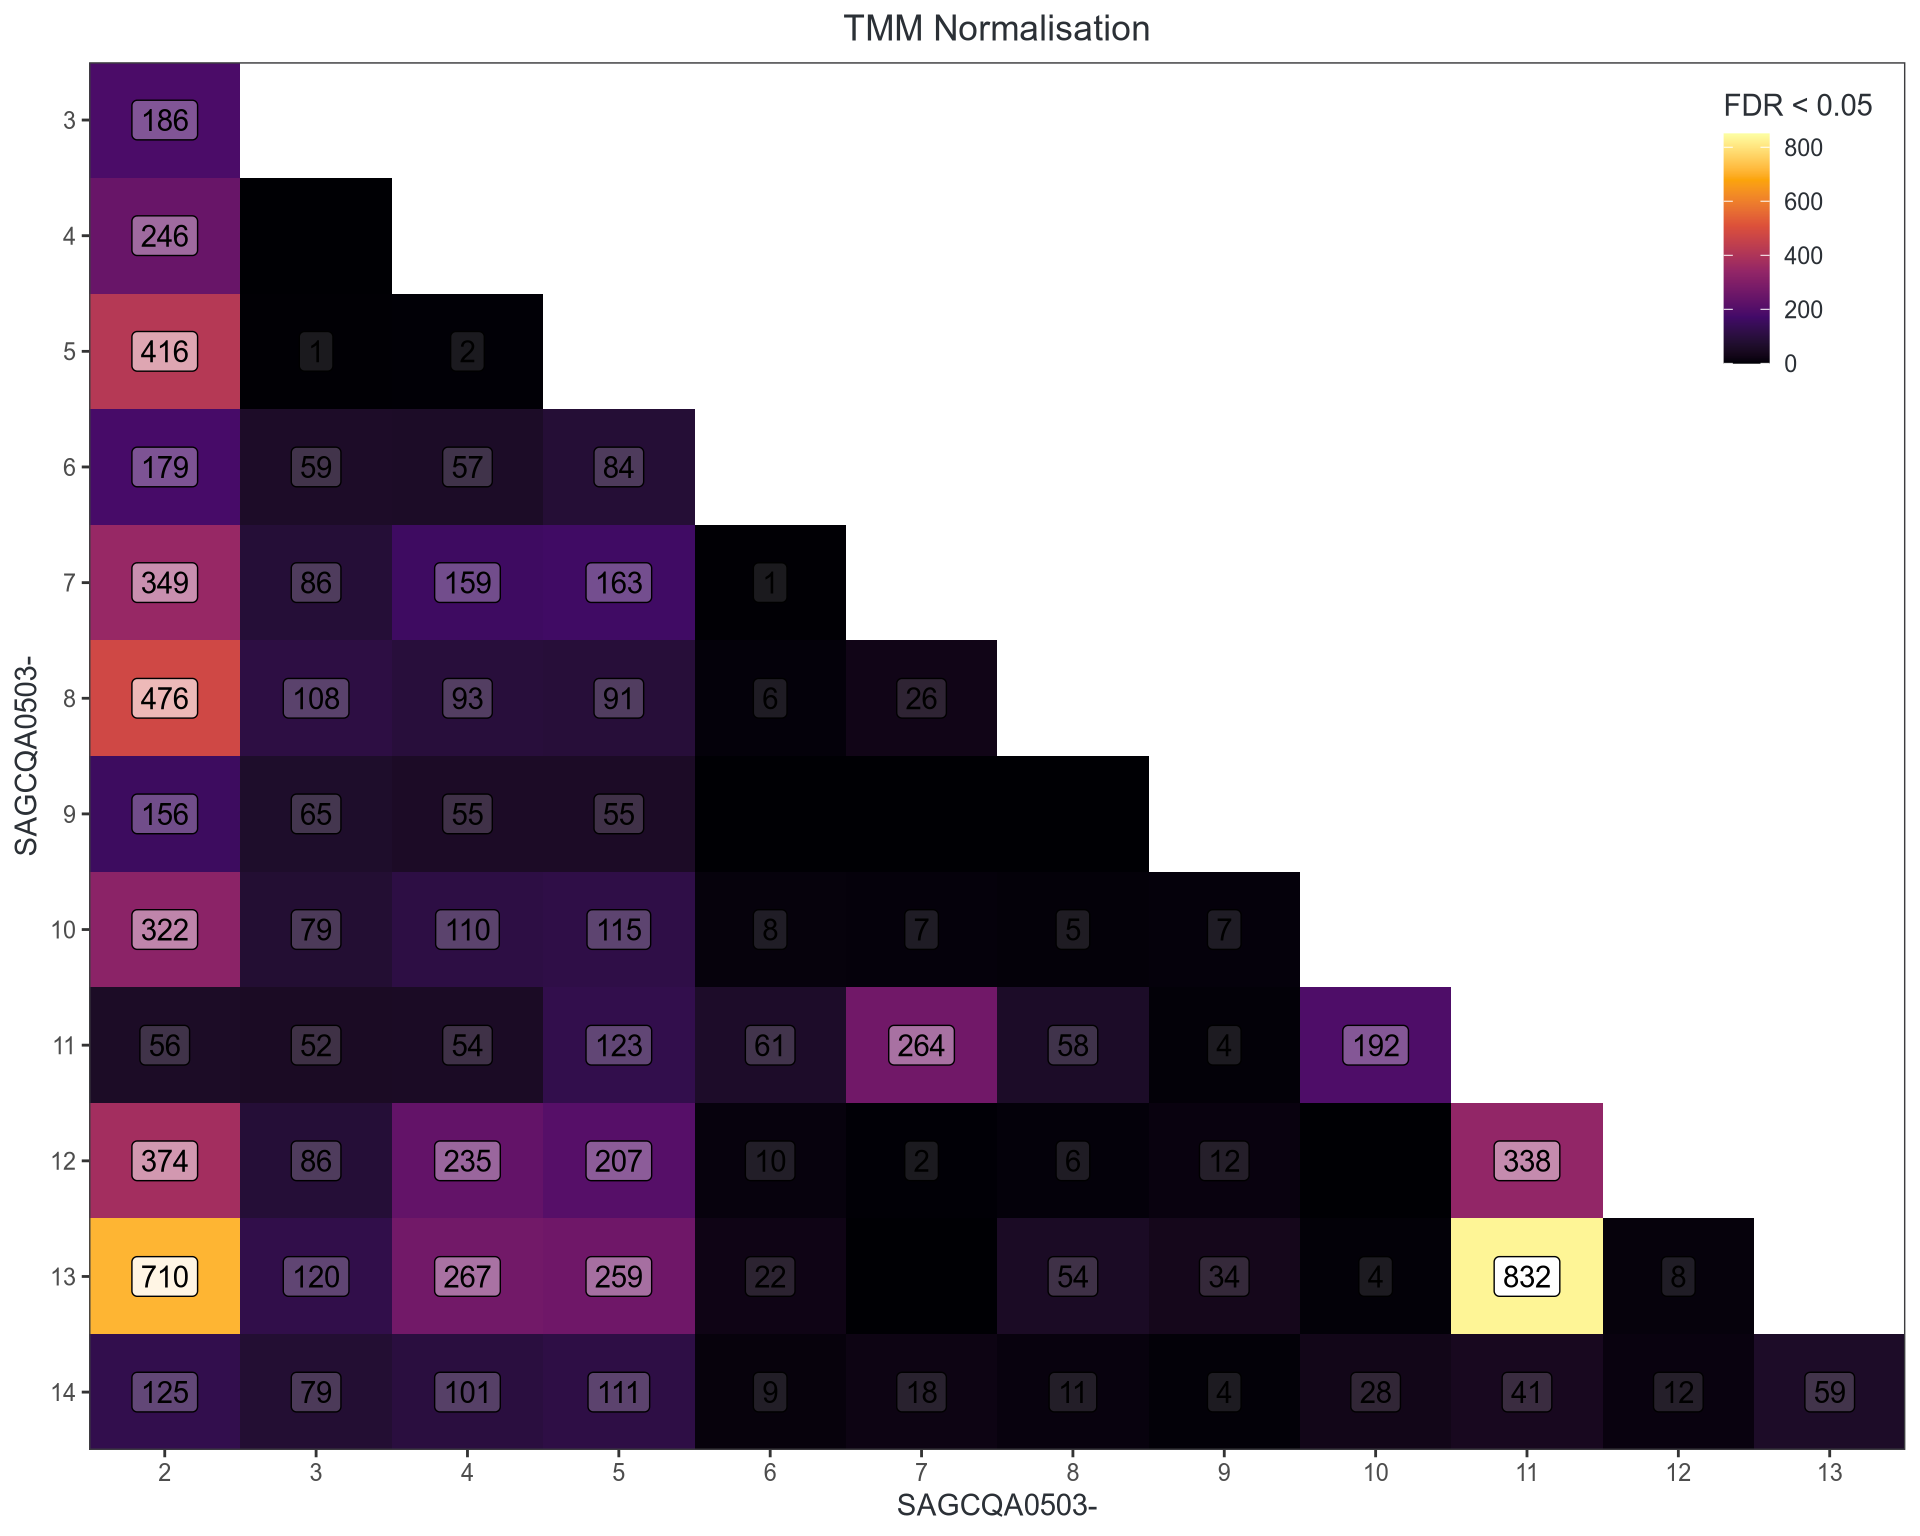
Similarity of QC Metrics
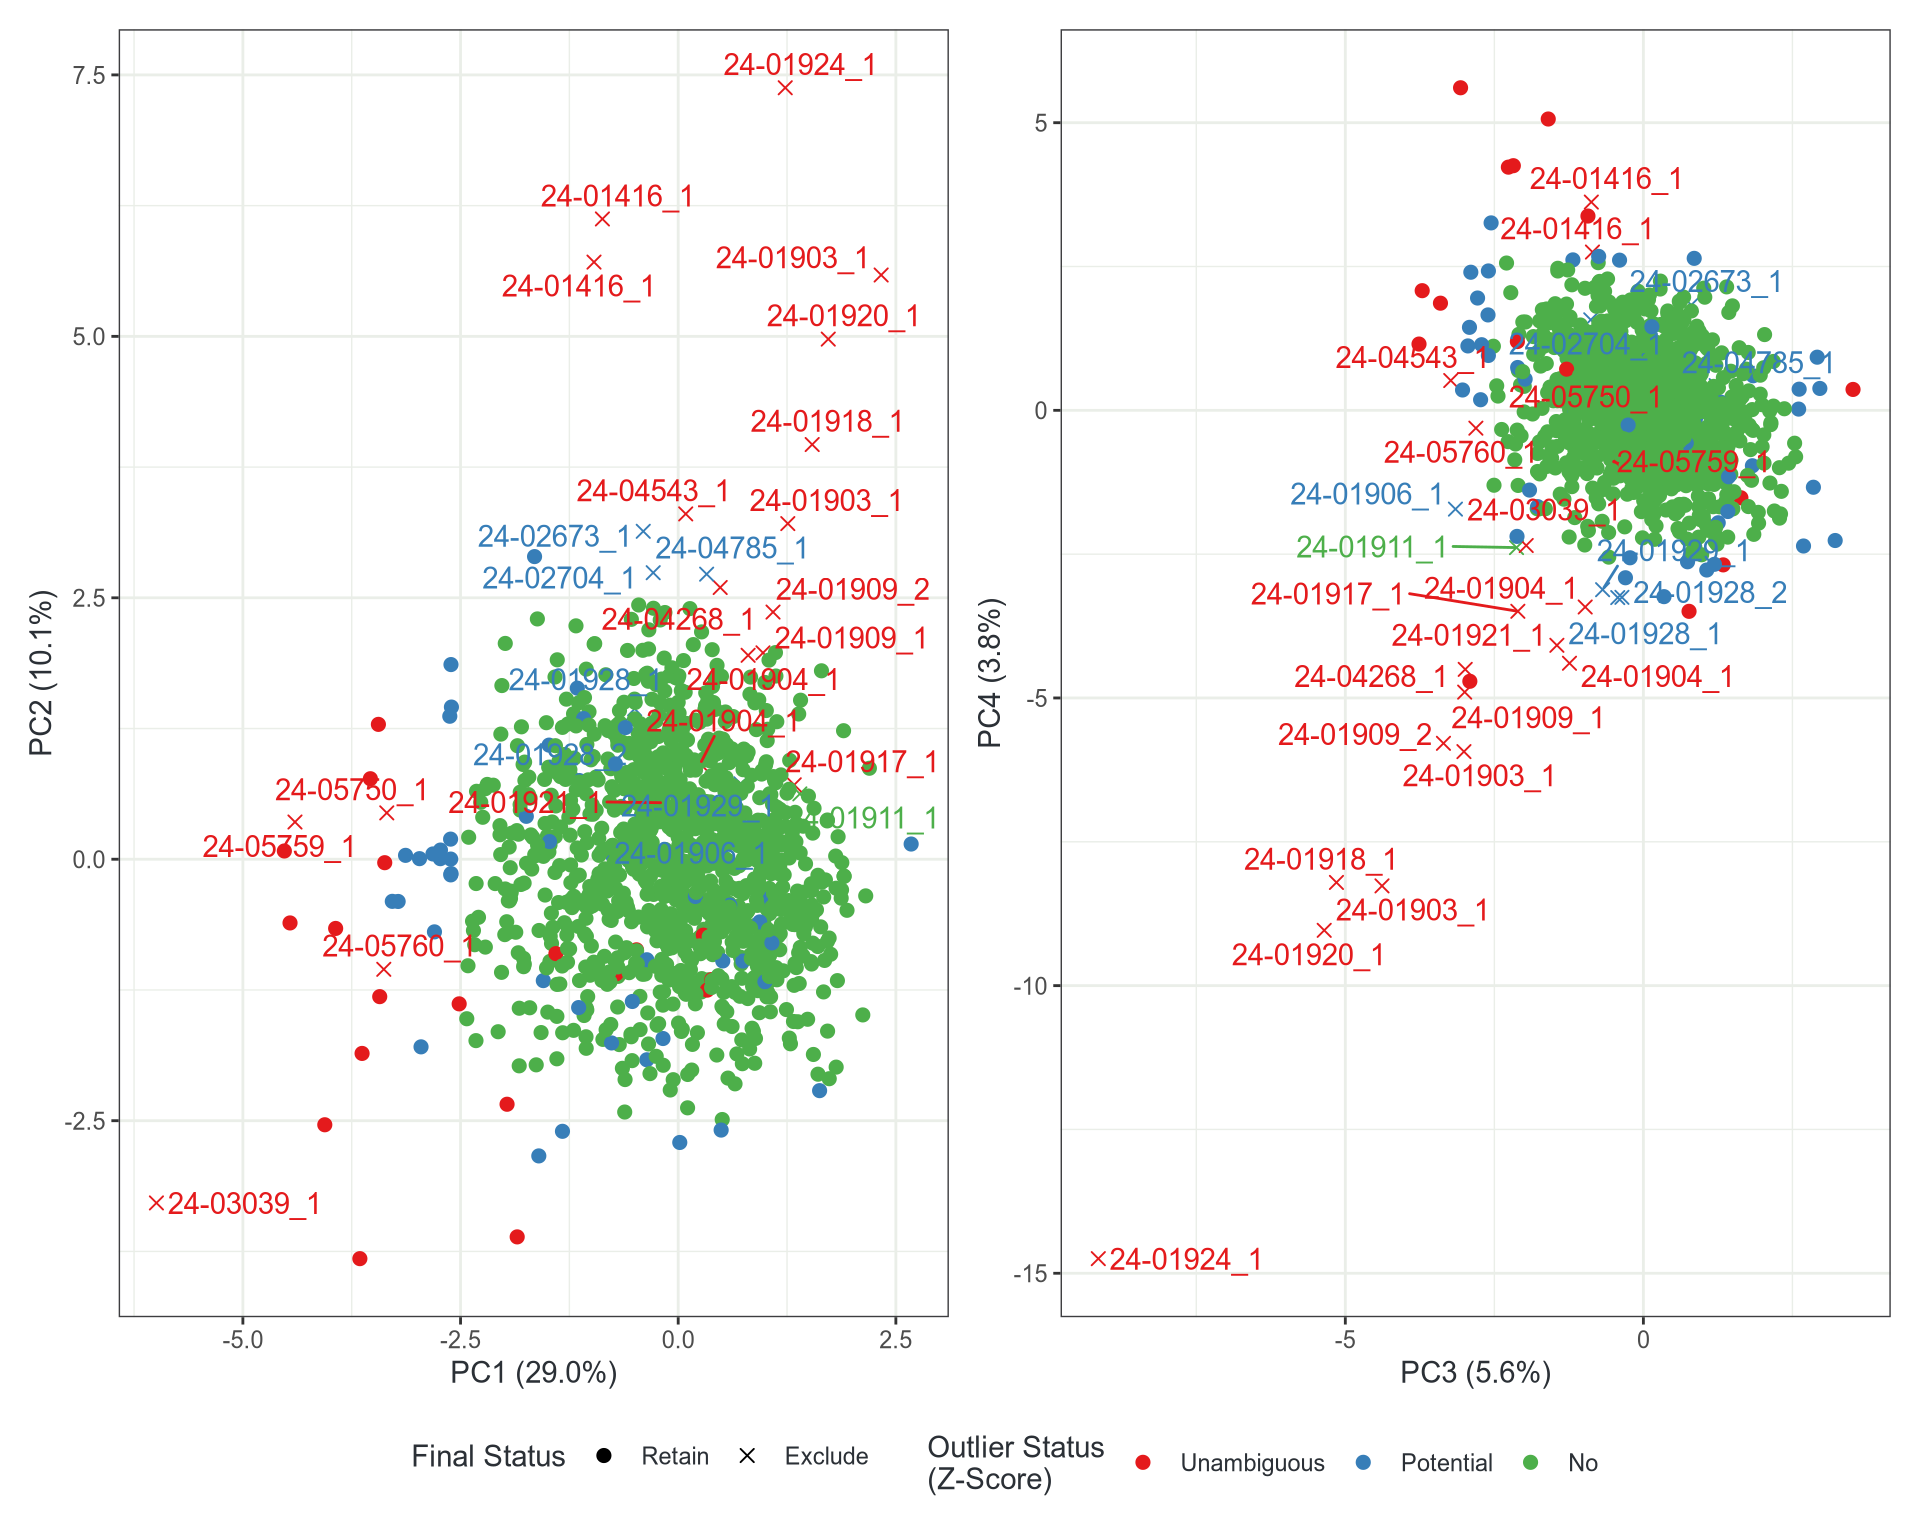
Outlier Detection
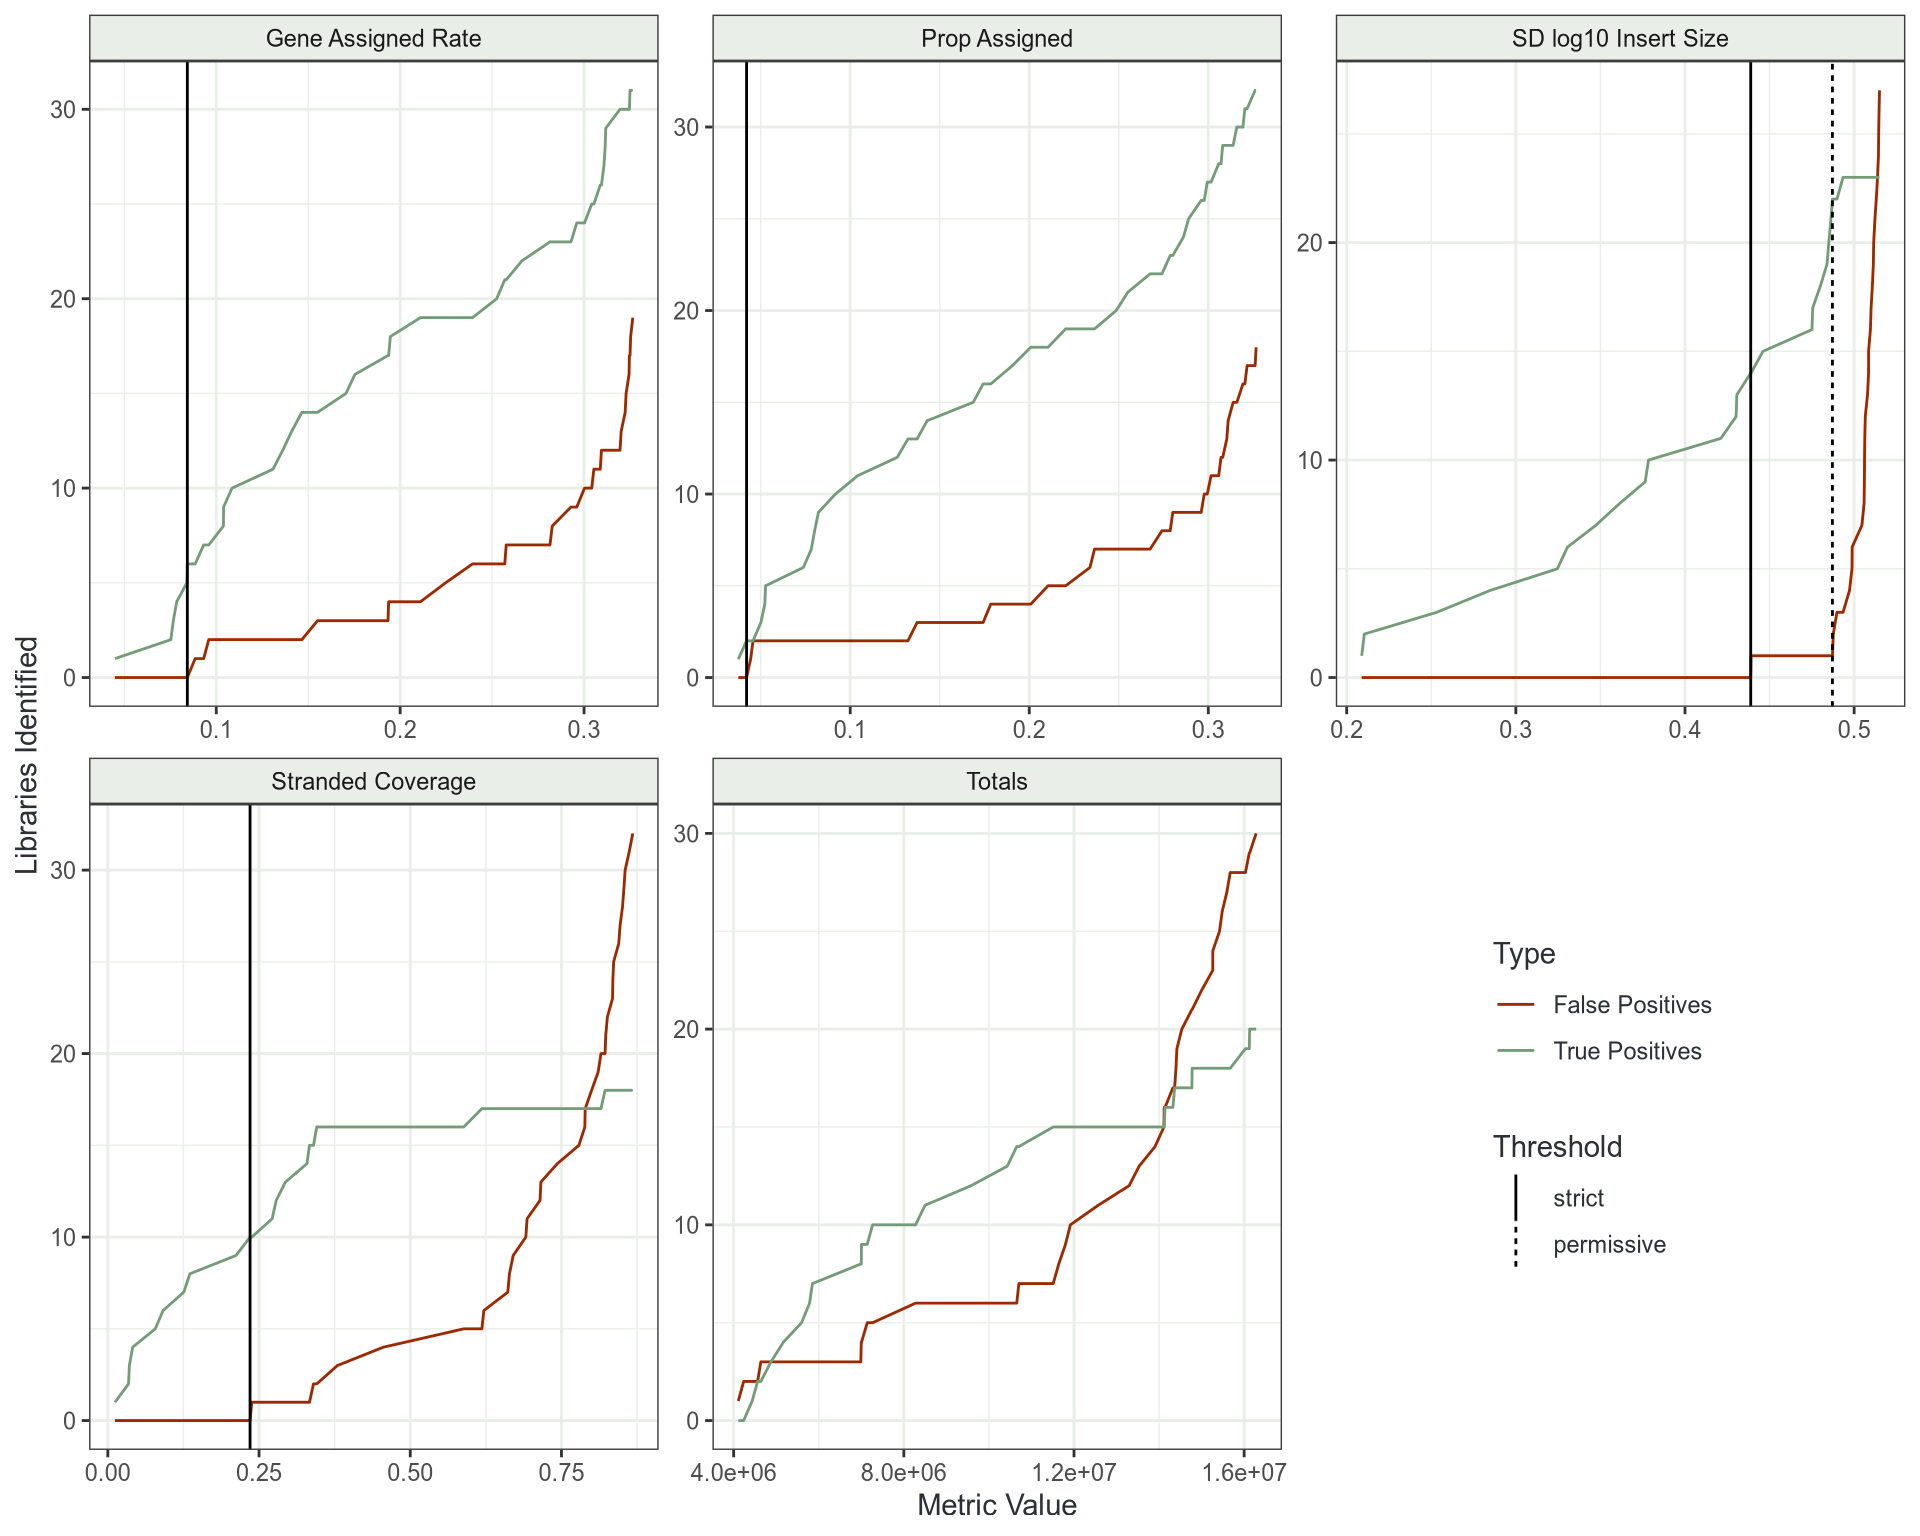
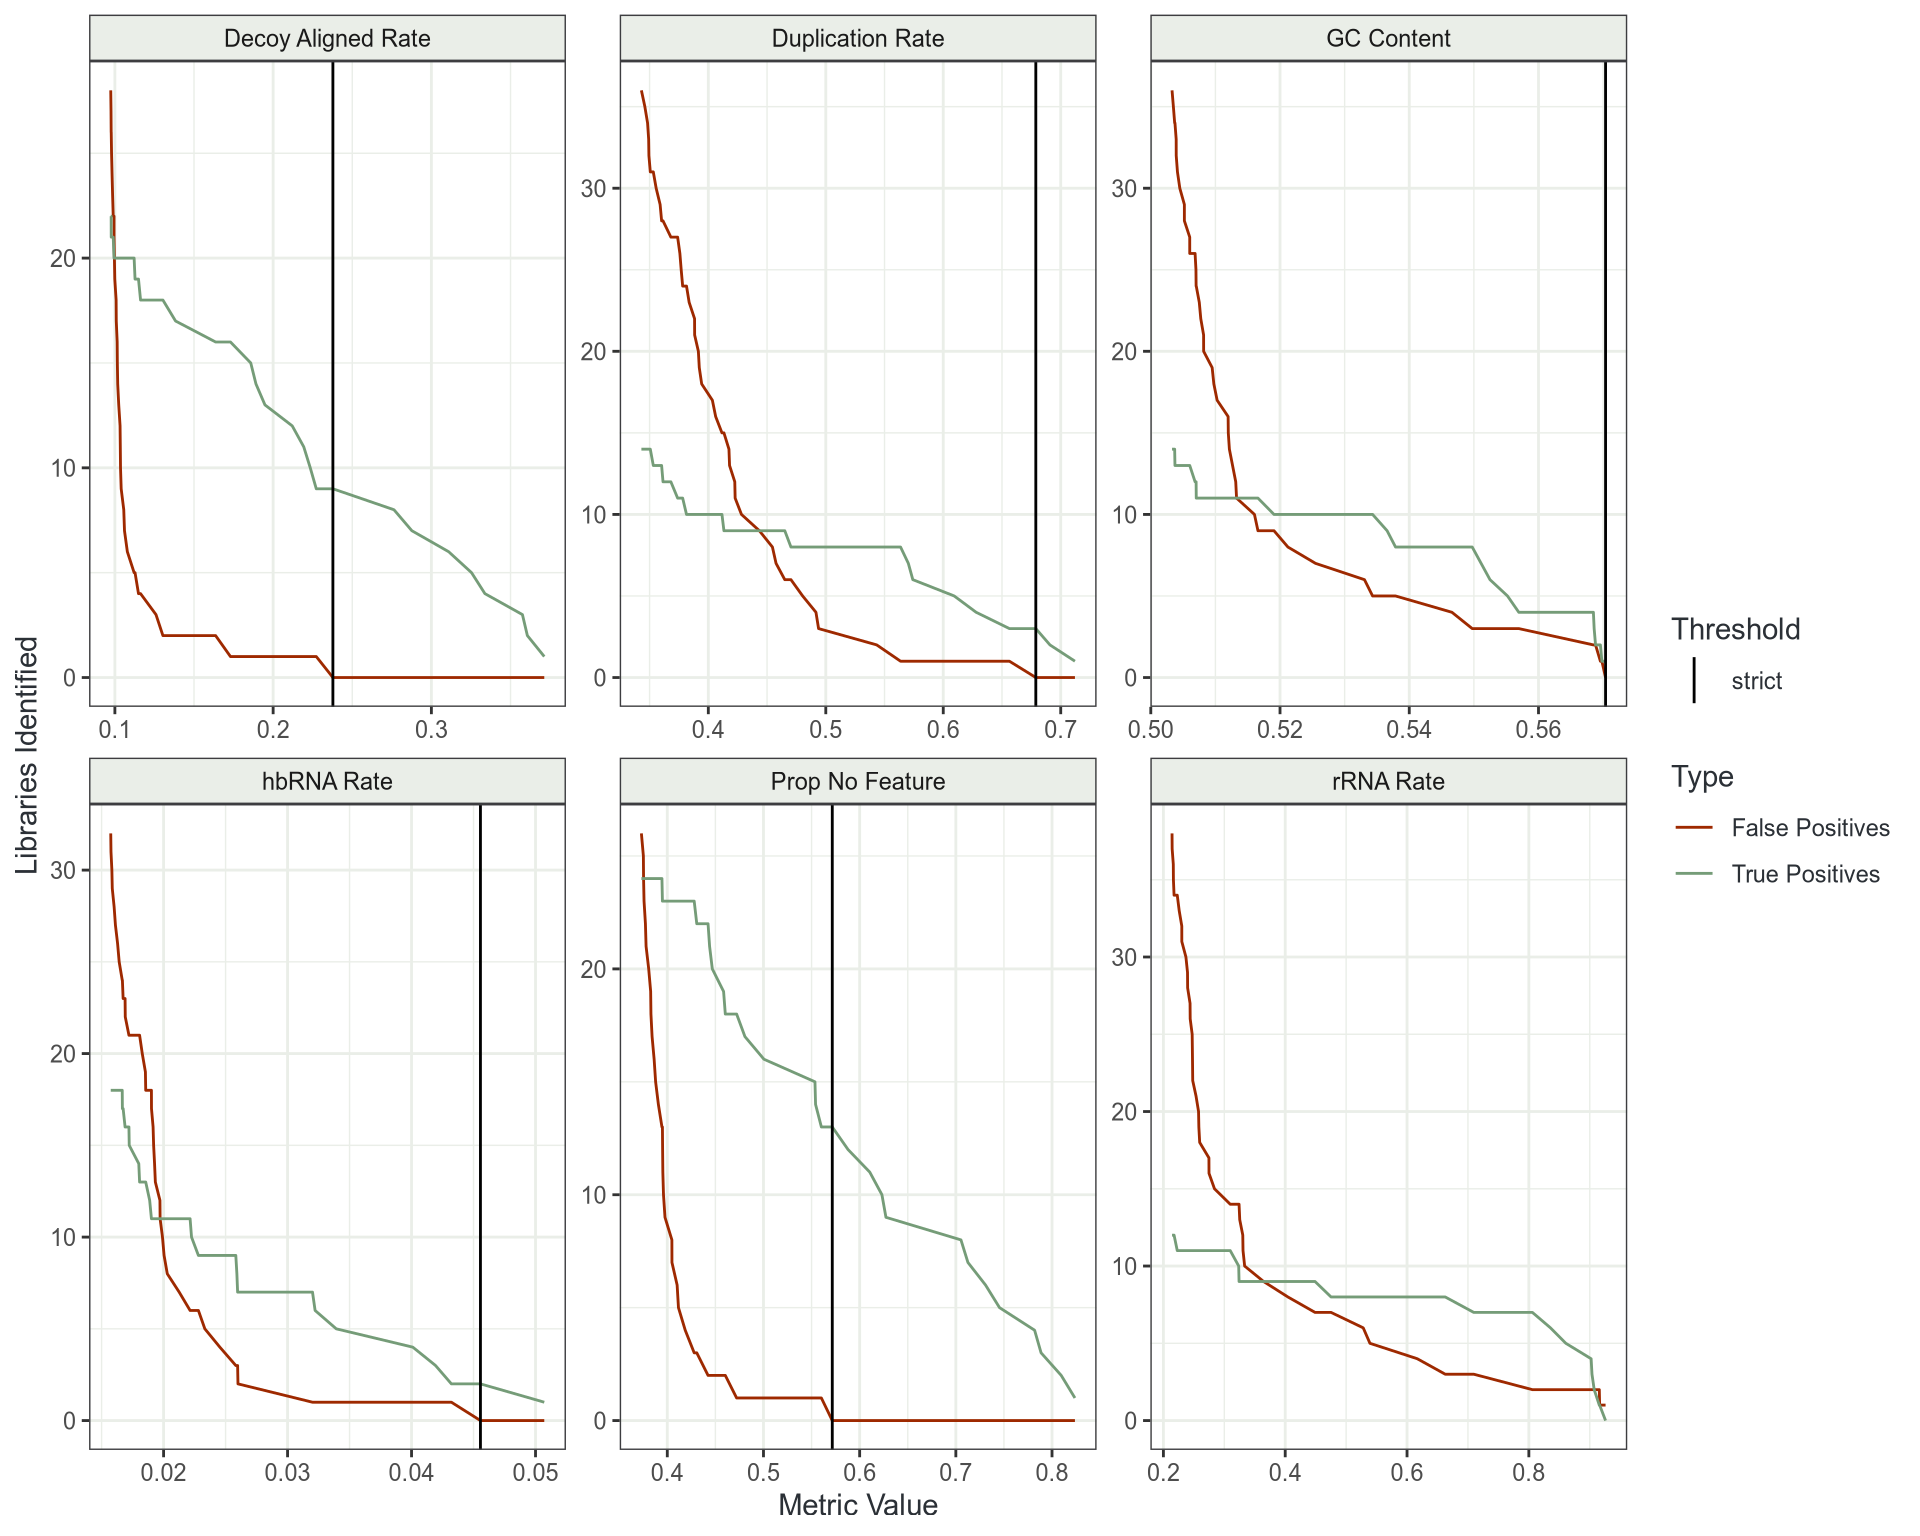
Outlier Detection
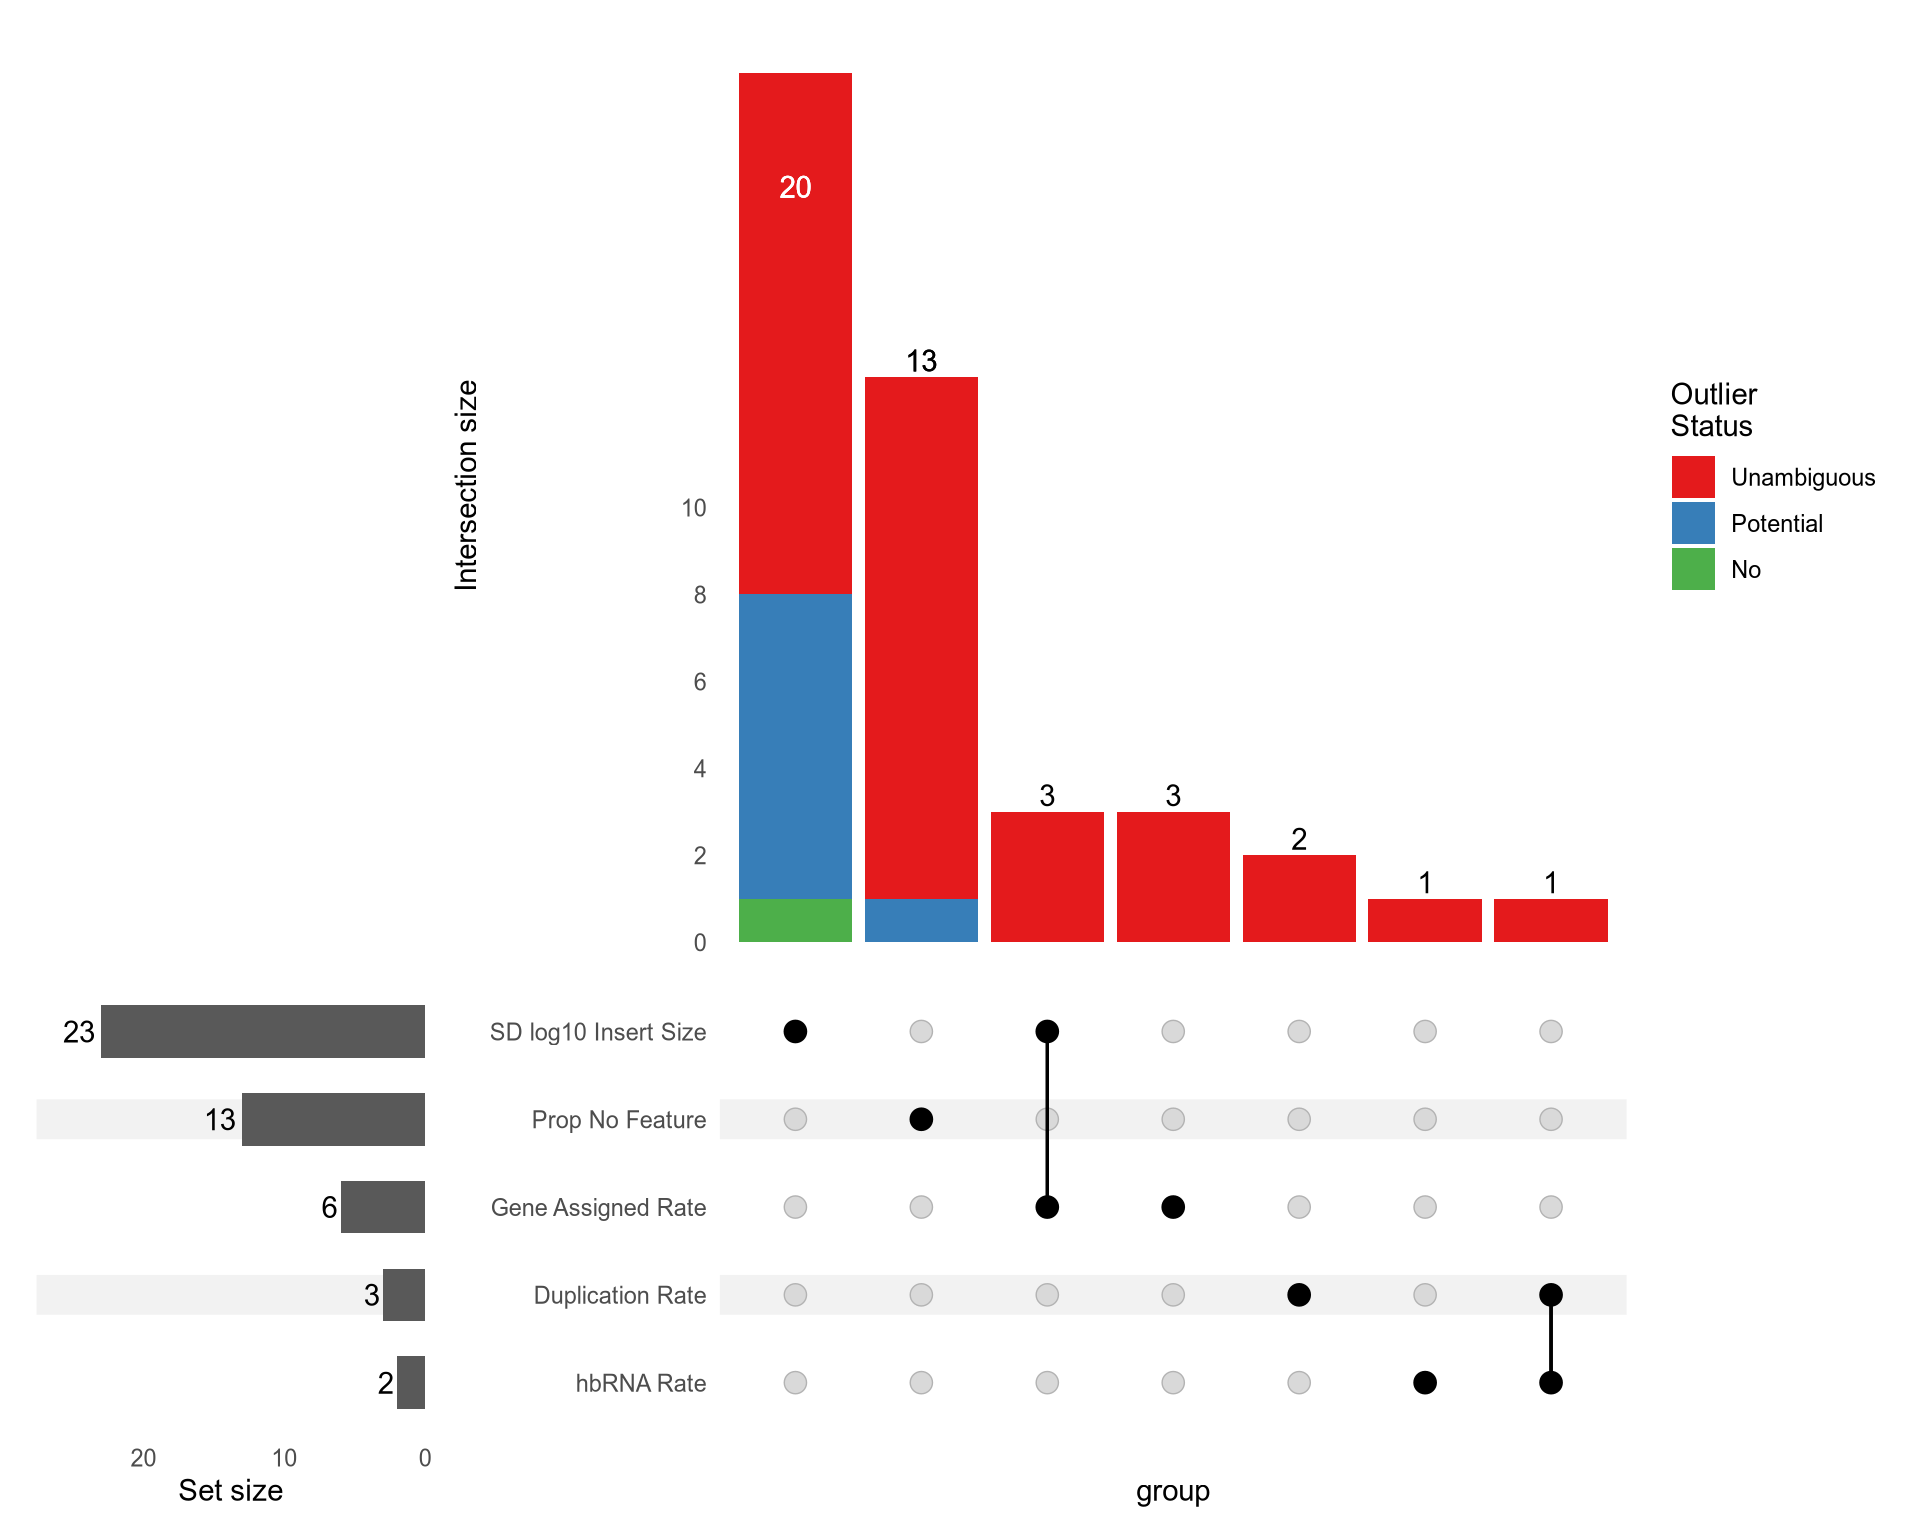
Outlier Detection
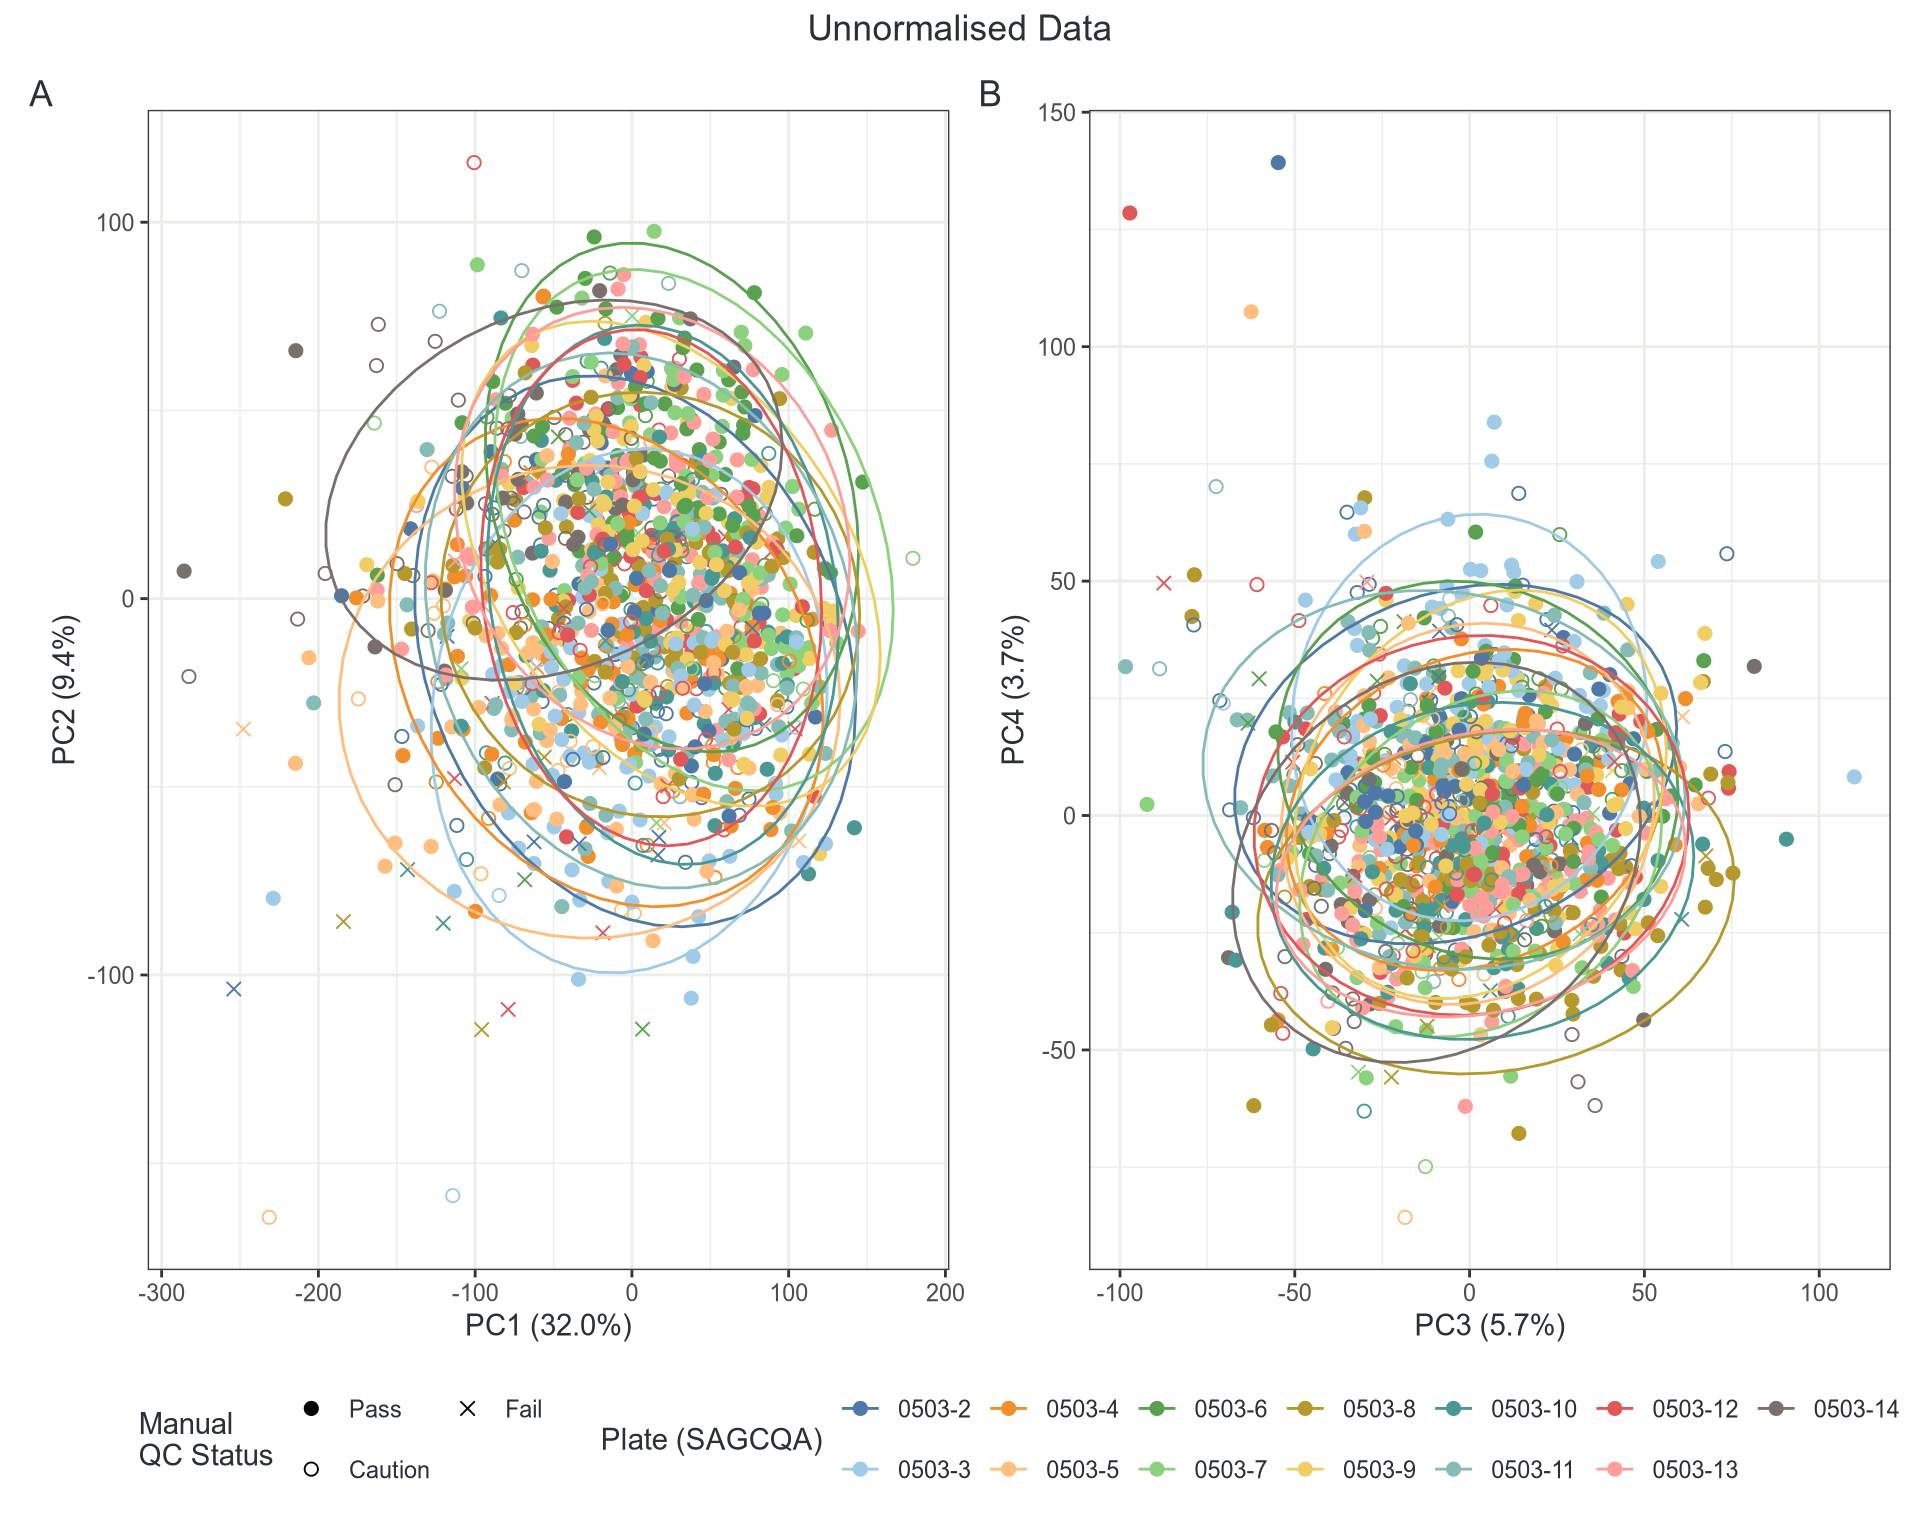
Batch Effects
GC & Length Artefacts
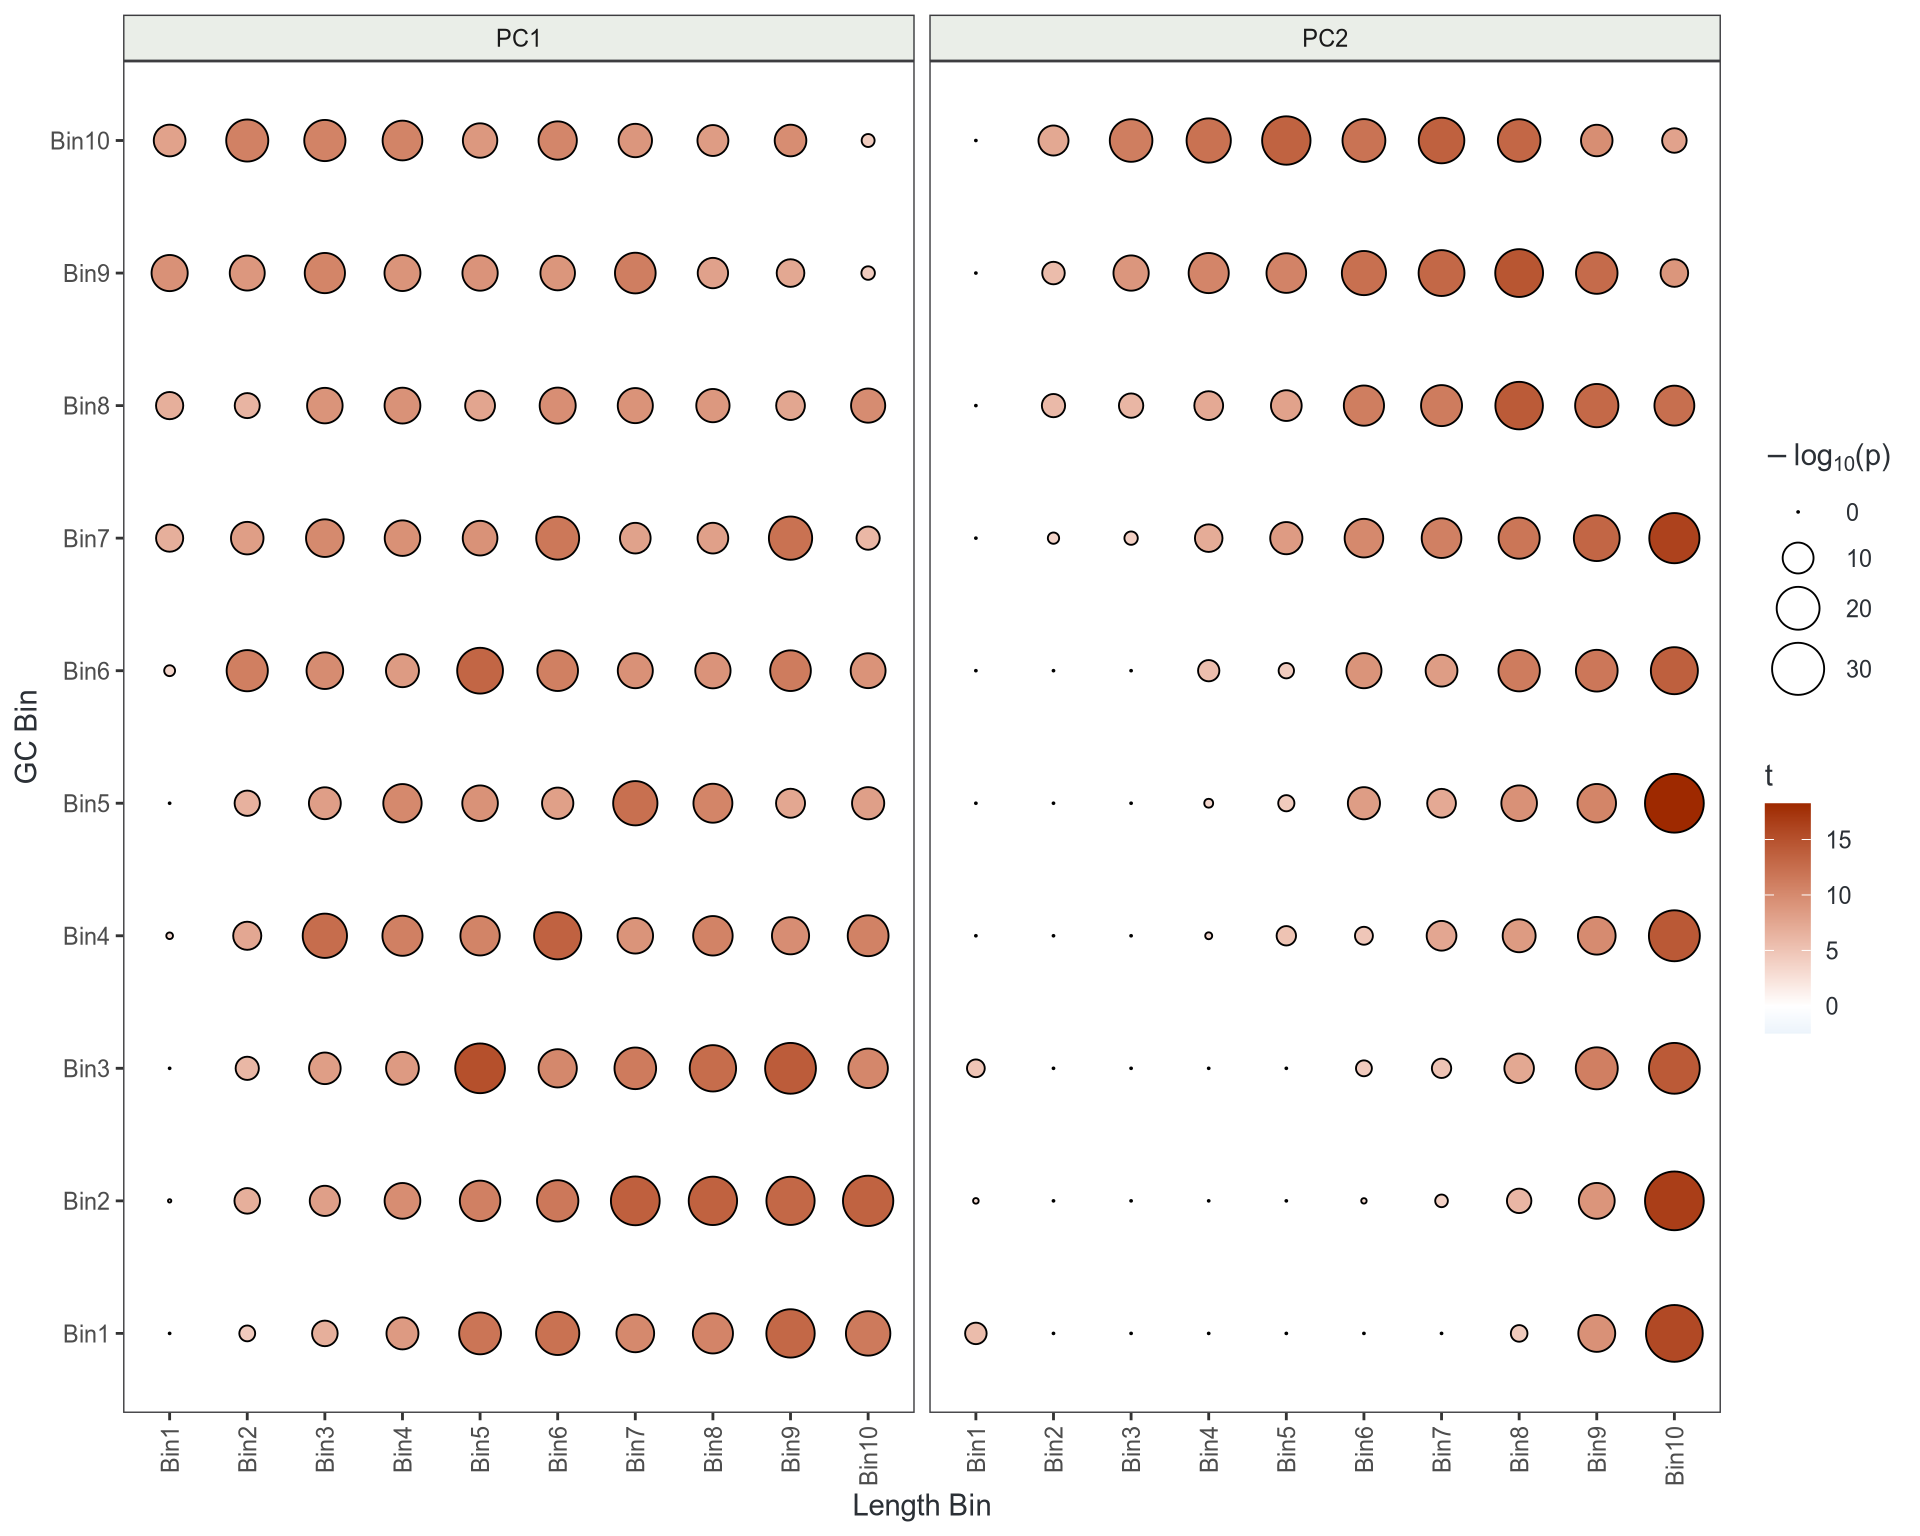
- Method developed by Lachlan Baer
- Bin gene-level rotations from PCA by GC & Length
- Perform \(t\)-test in each bin
- If no bias \(\implies\) random noise
- Looks like GC & length is impacting signal
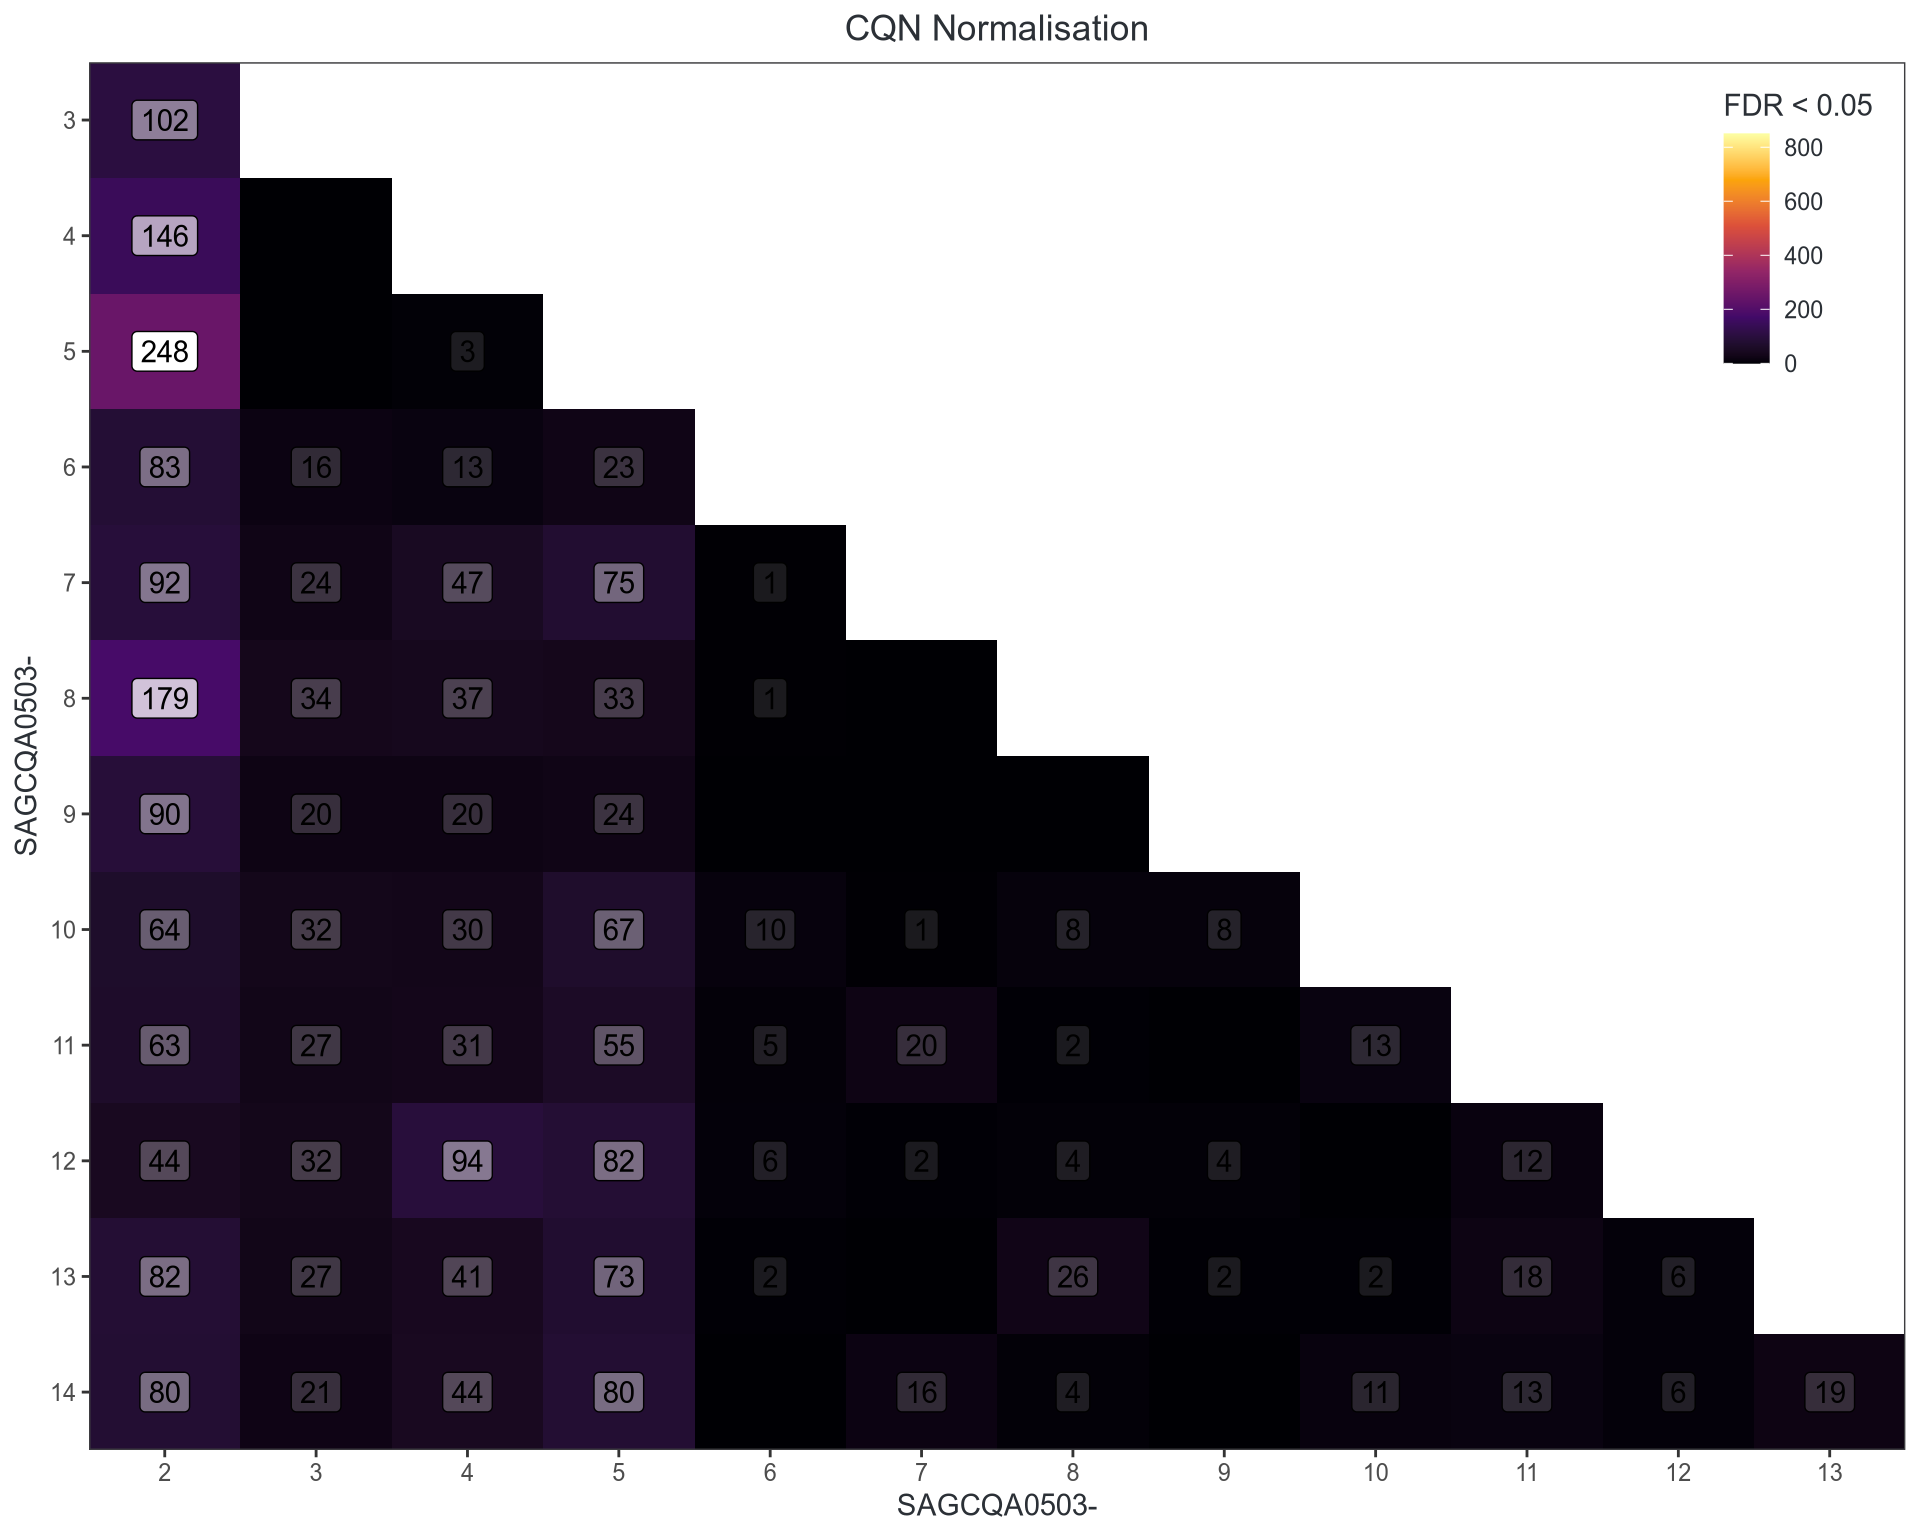
Conditional Quantile Normalisation
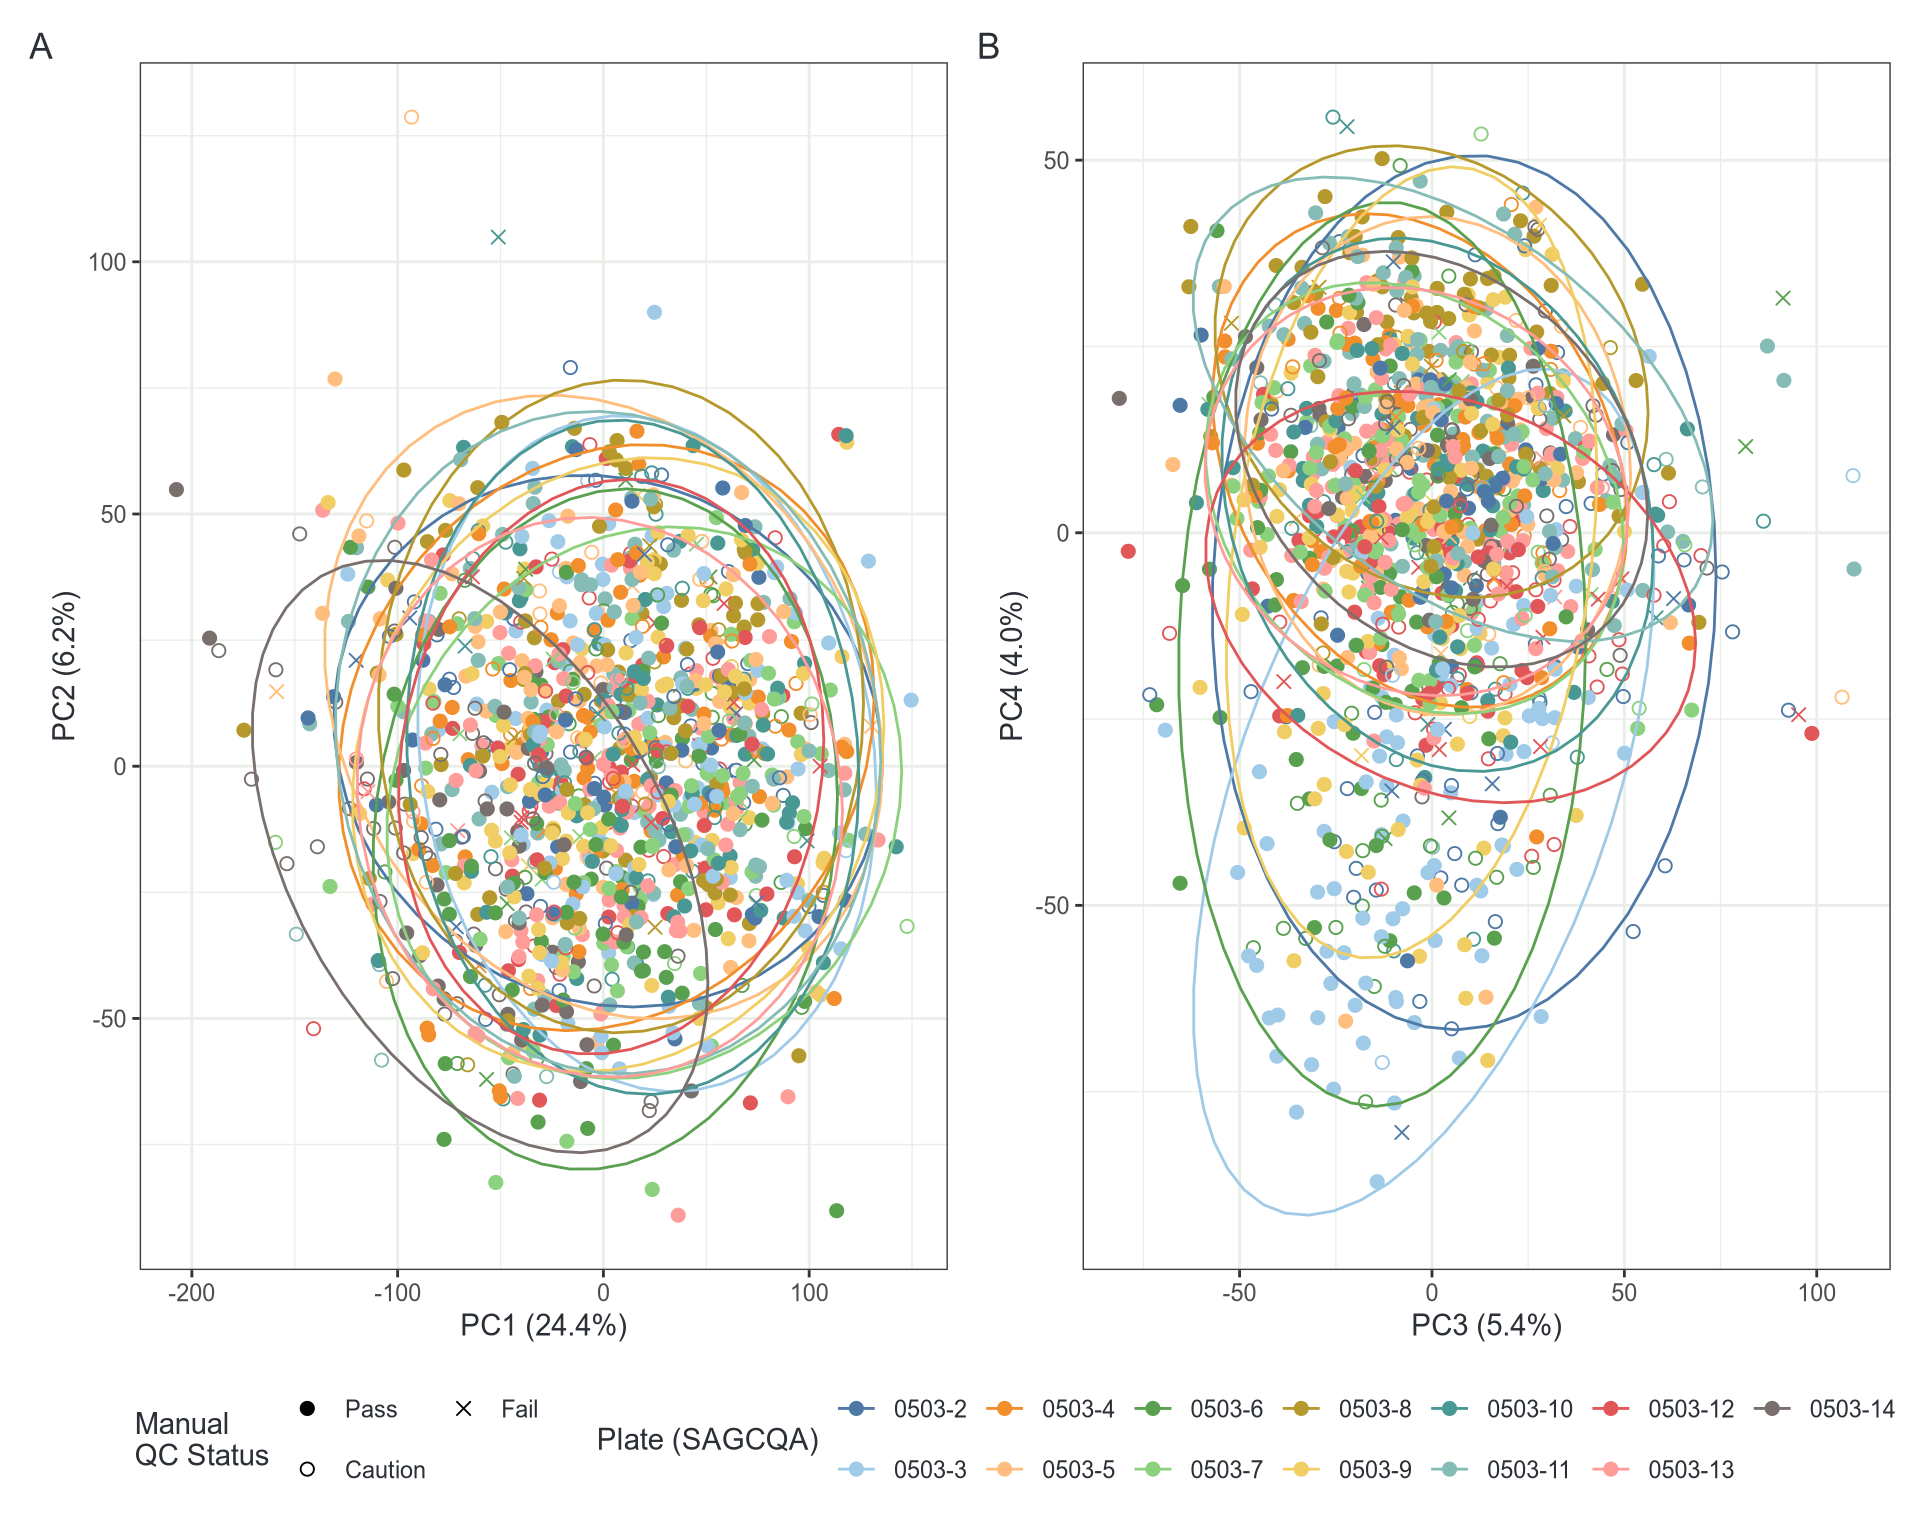
PC4 captures age 🎉
Performance on Pools
Both improve further using glmTreat() at FC > 1.1
Do Any QC Metrics Impact Signal
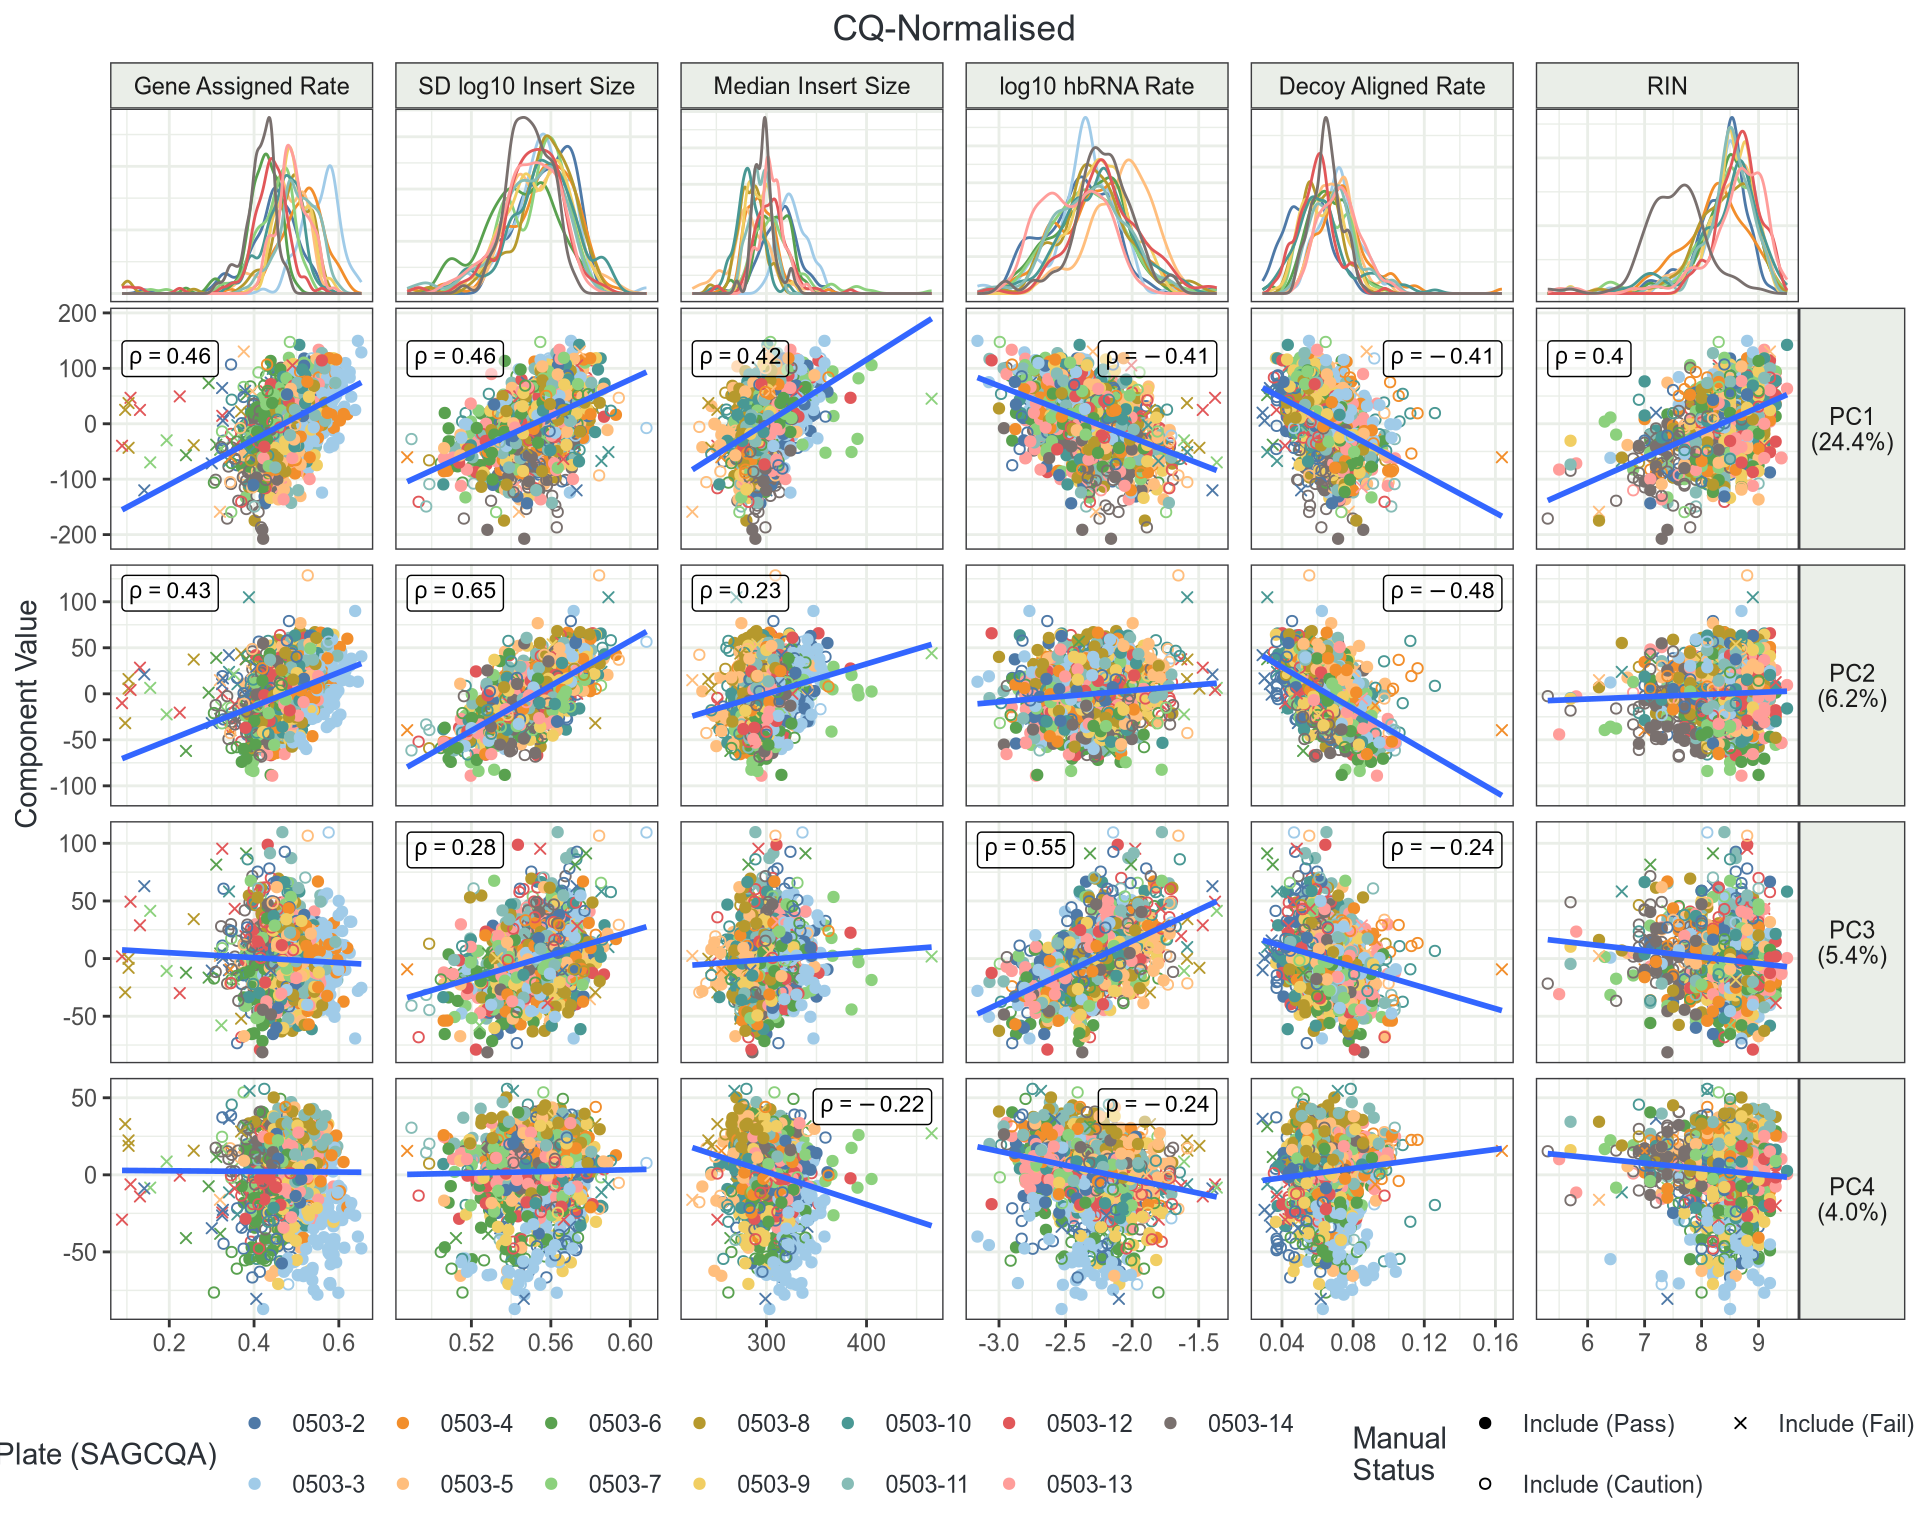
- Several QC metrics strongly correlate with PC1-3
- How will this impact DGE analysis?
- Can I check?
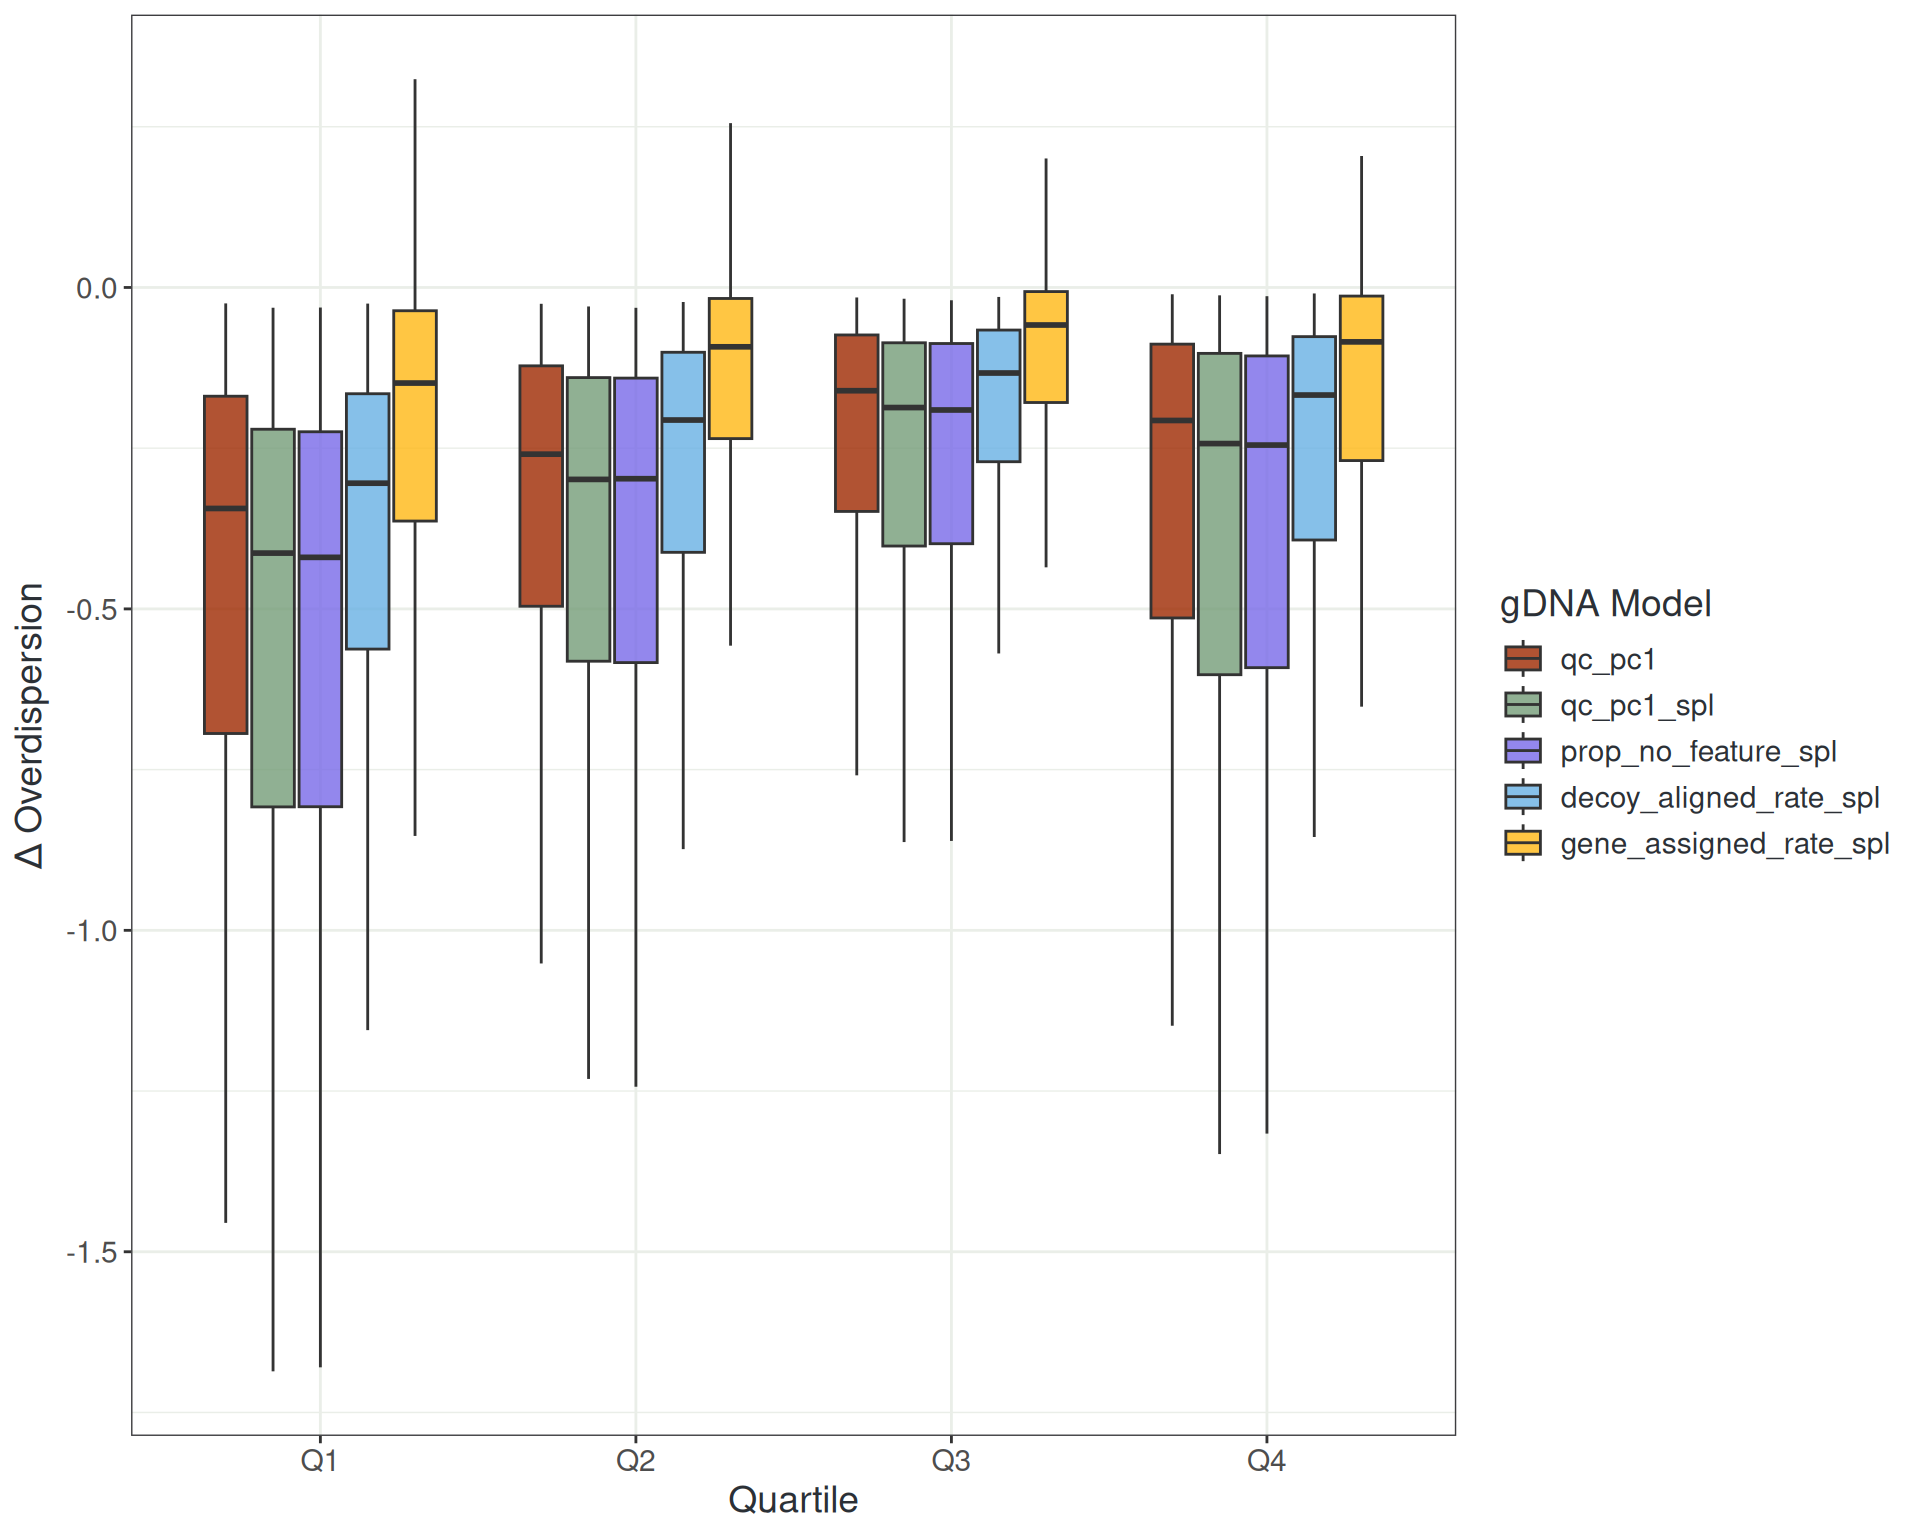
Managing Noise: gDNA Metrics
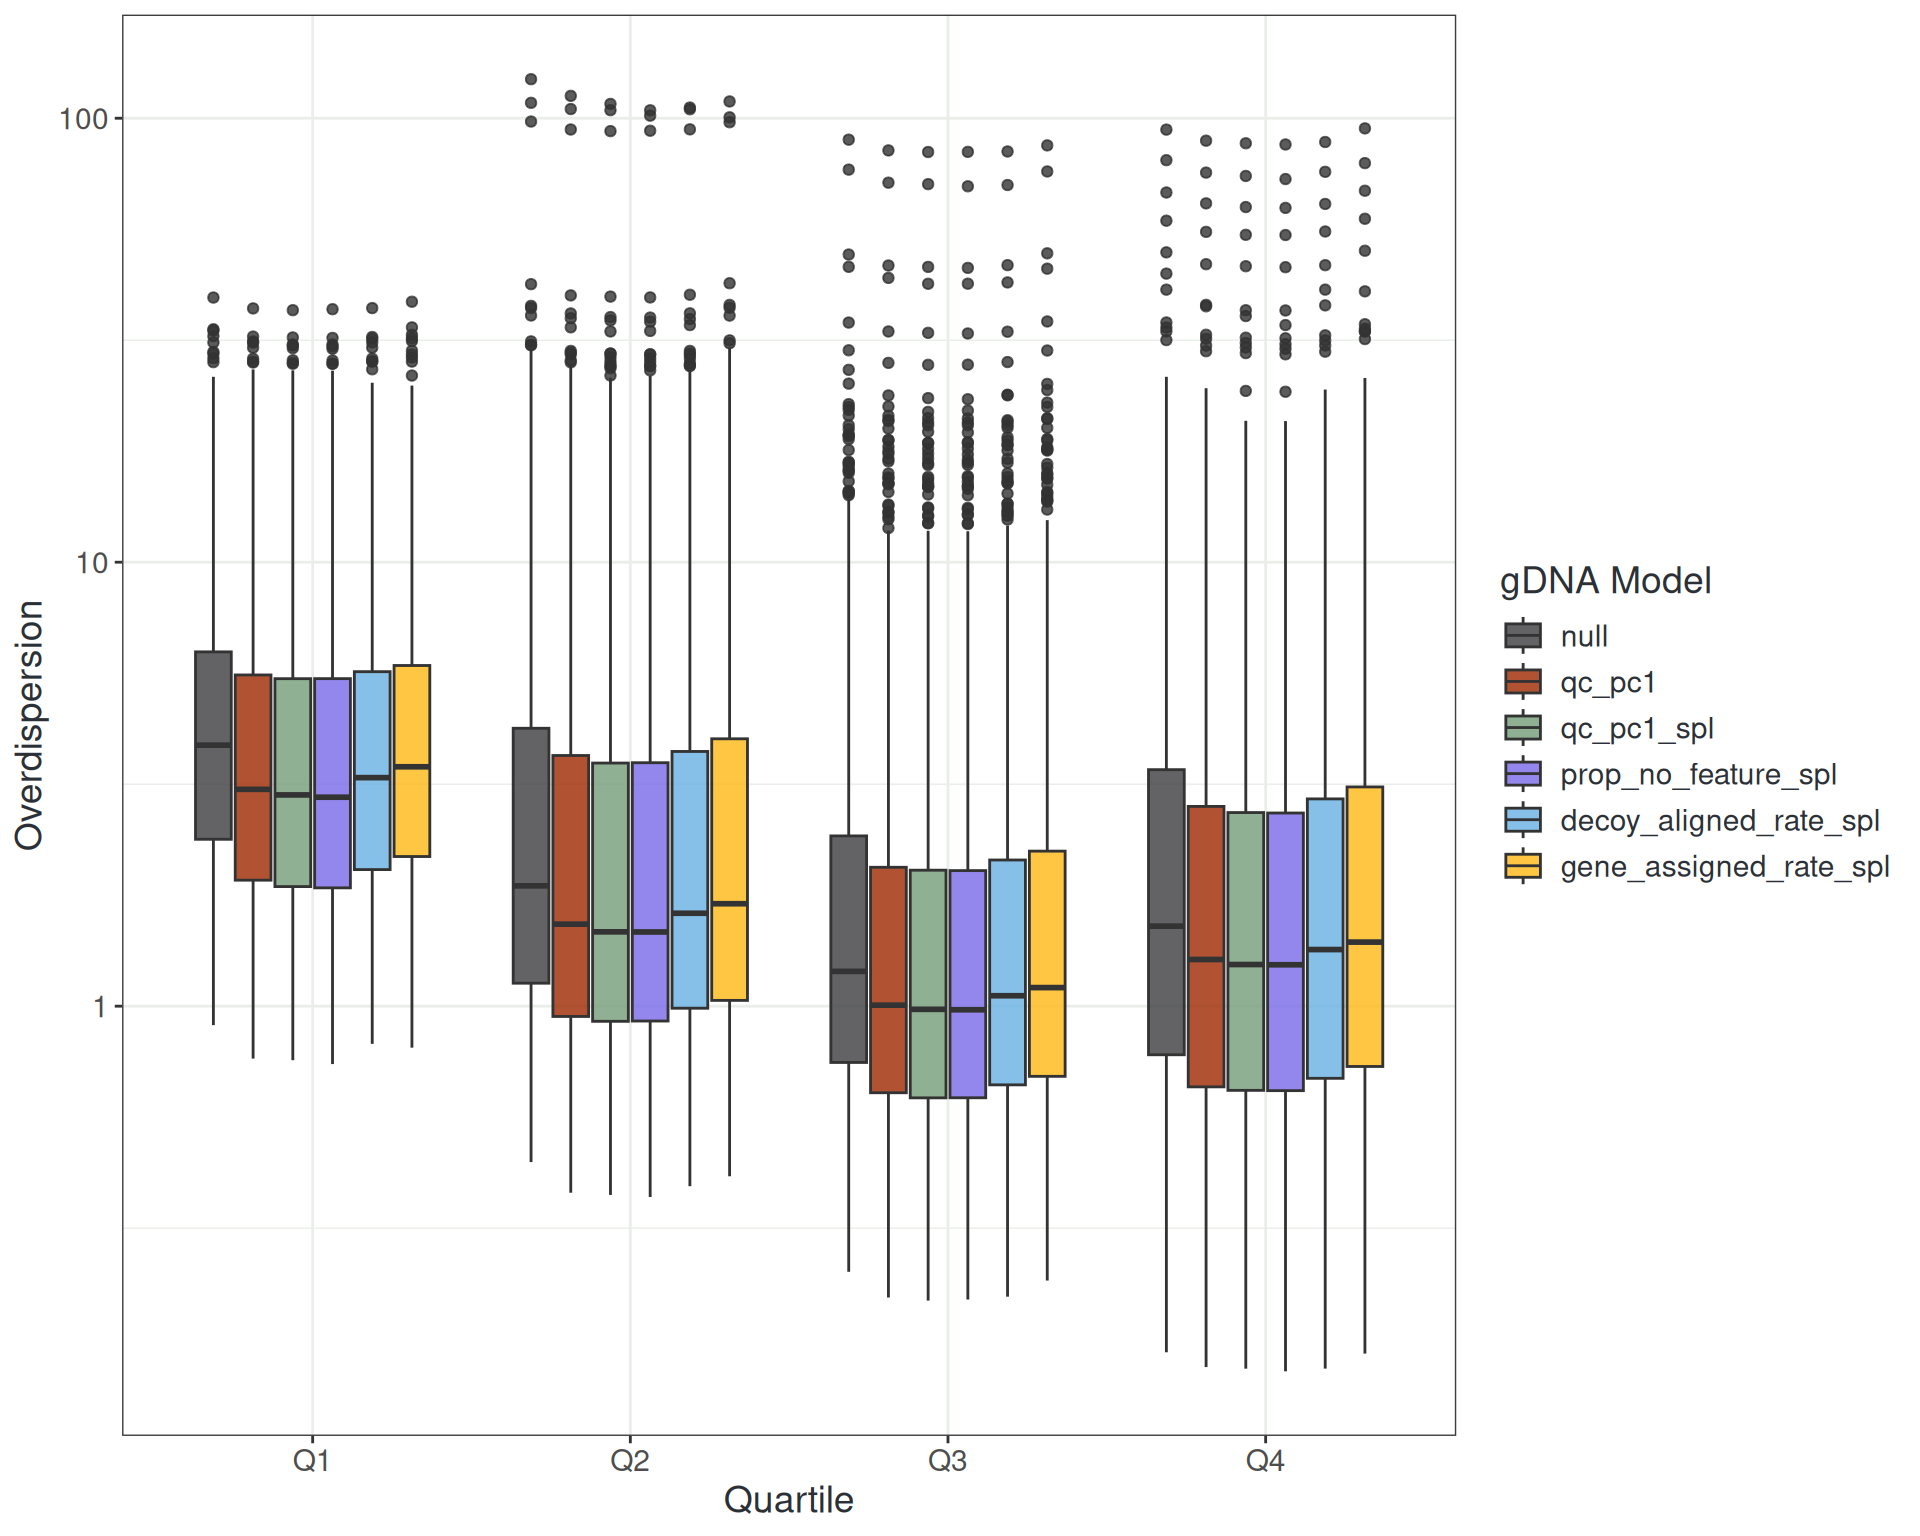
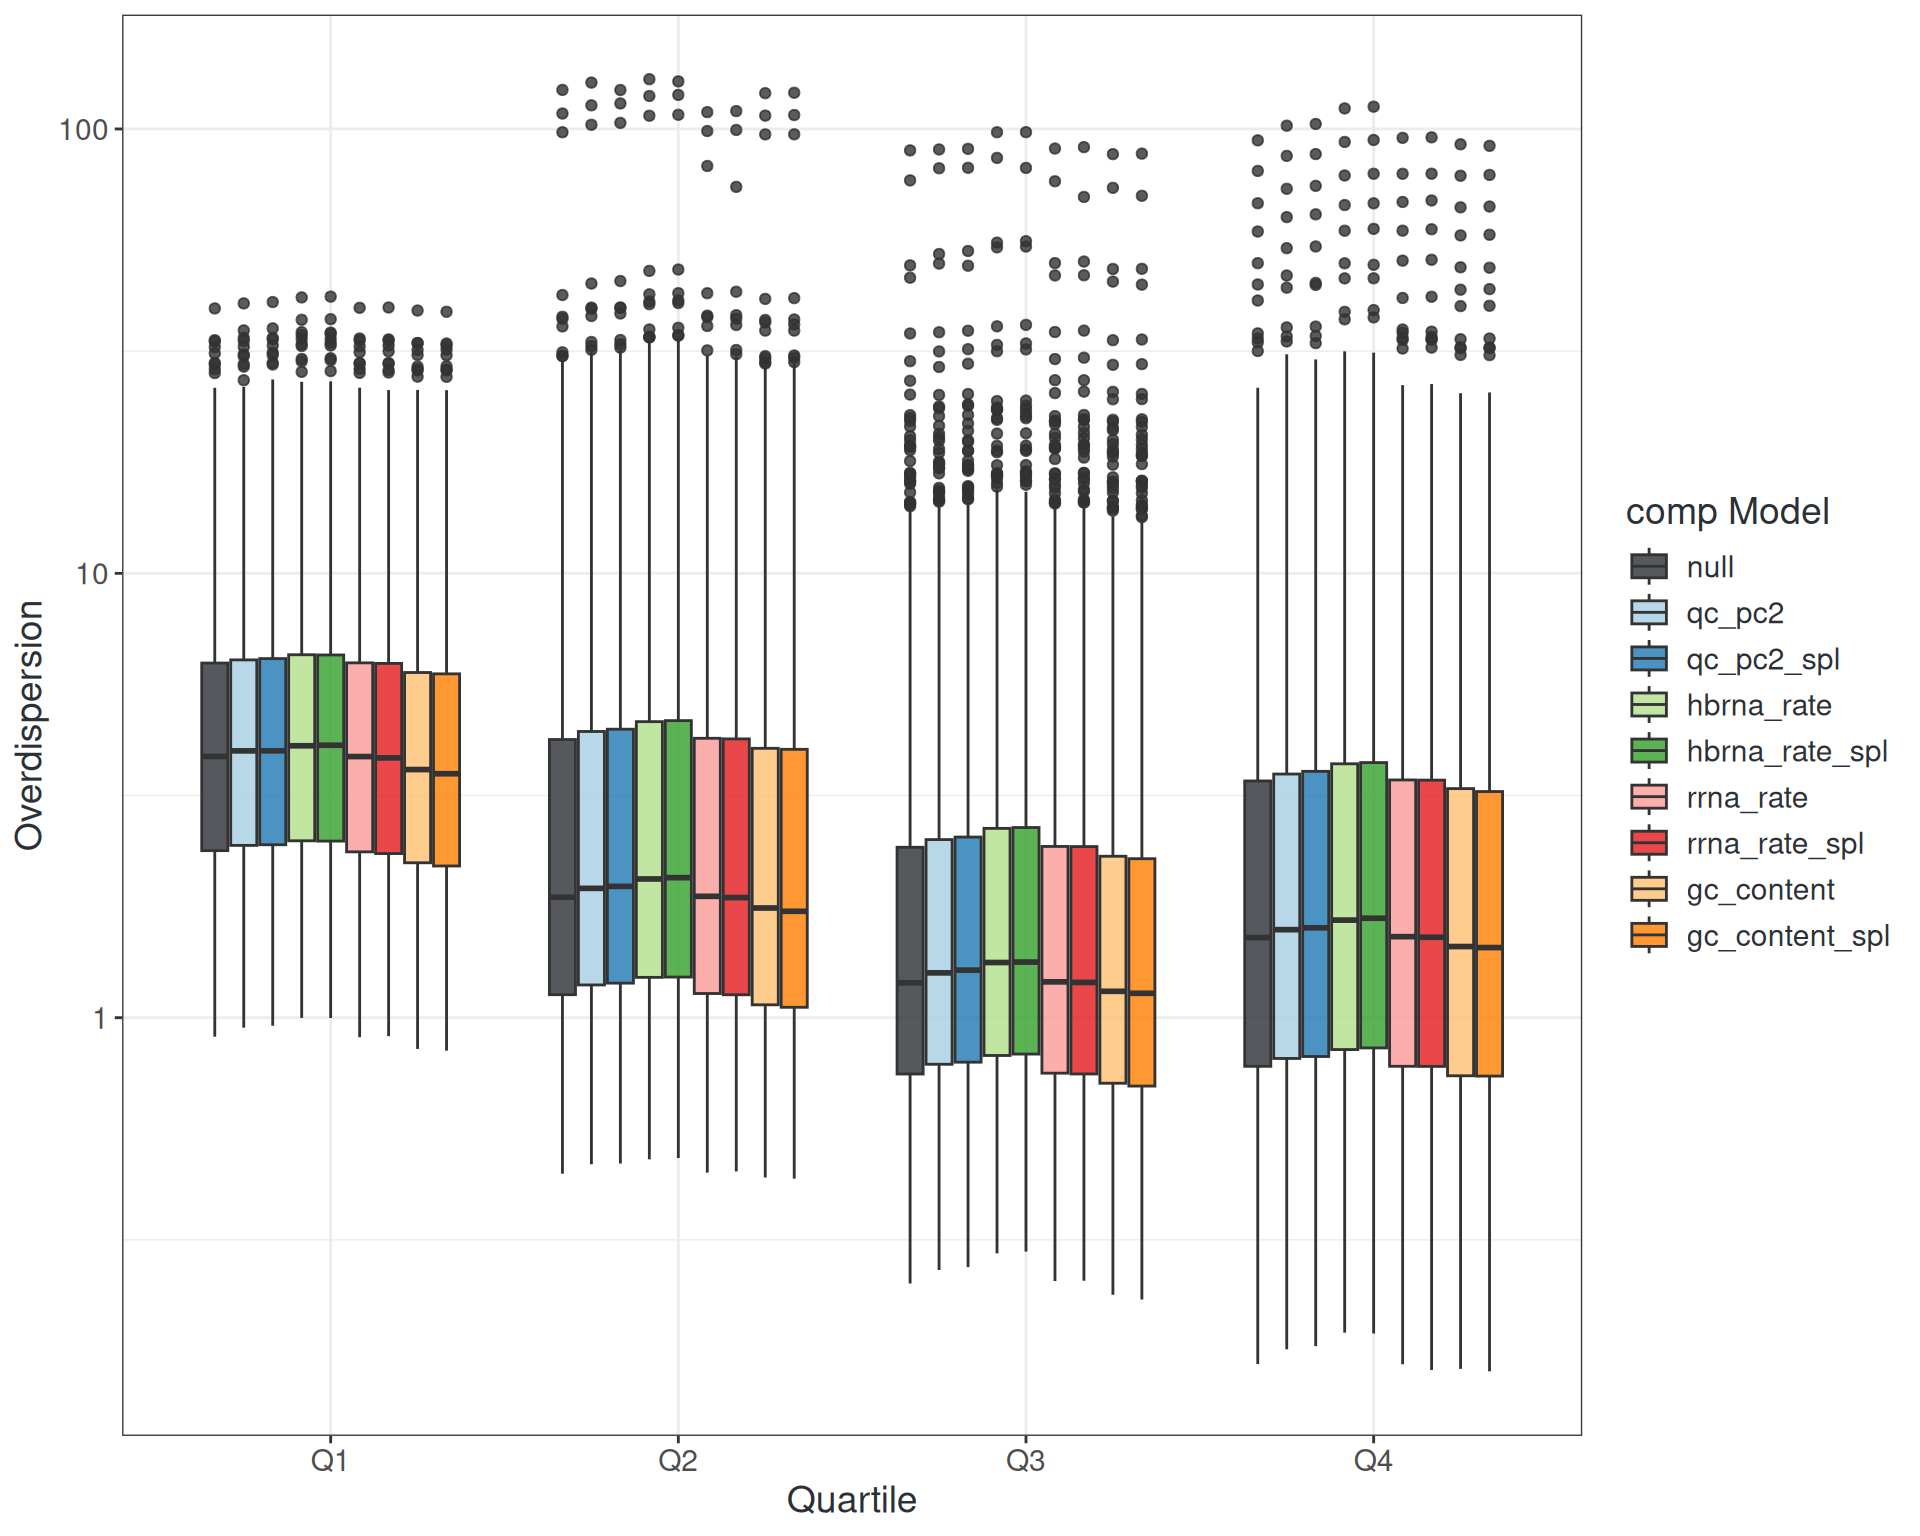
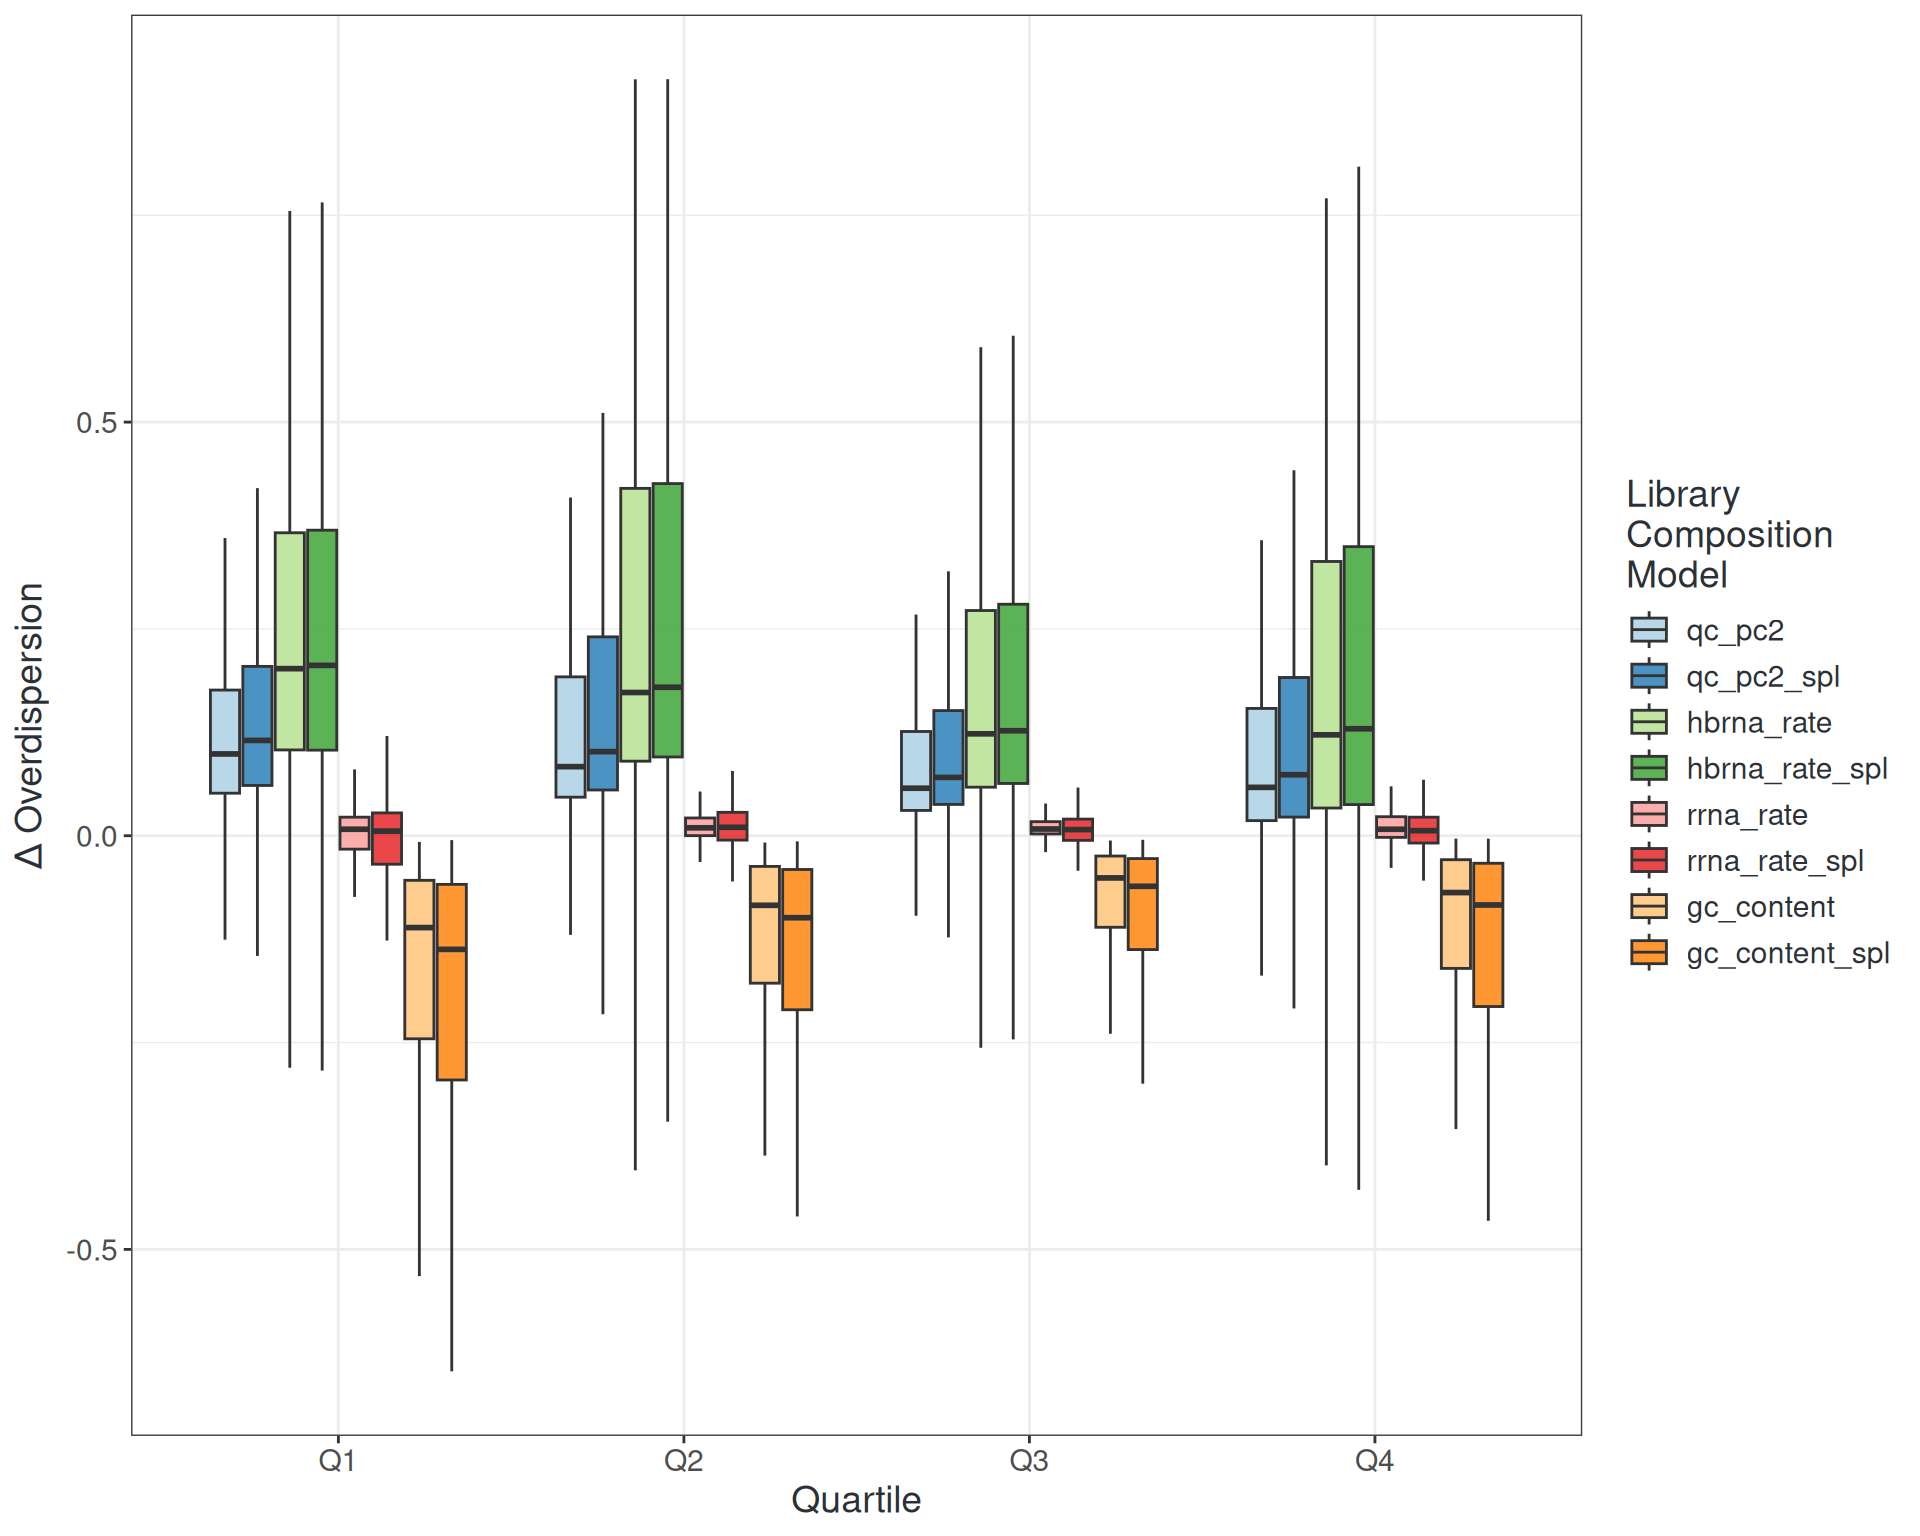
Managing Noise: Library Composition
Managing Noise: Combined Metrics
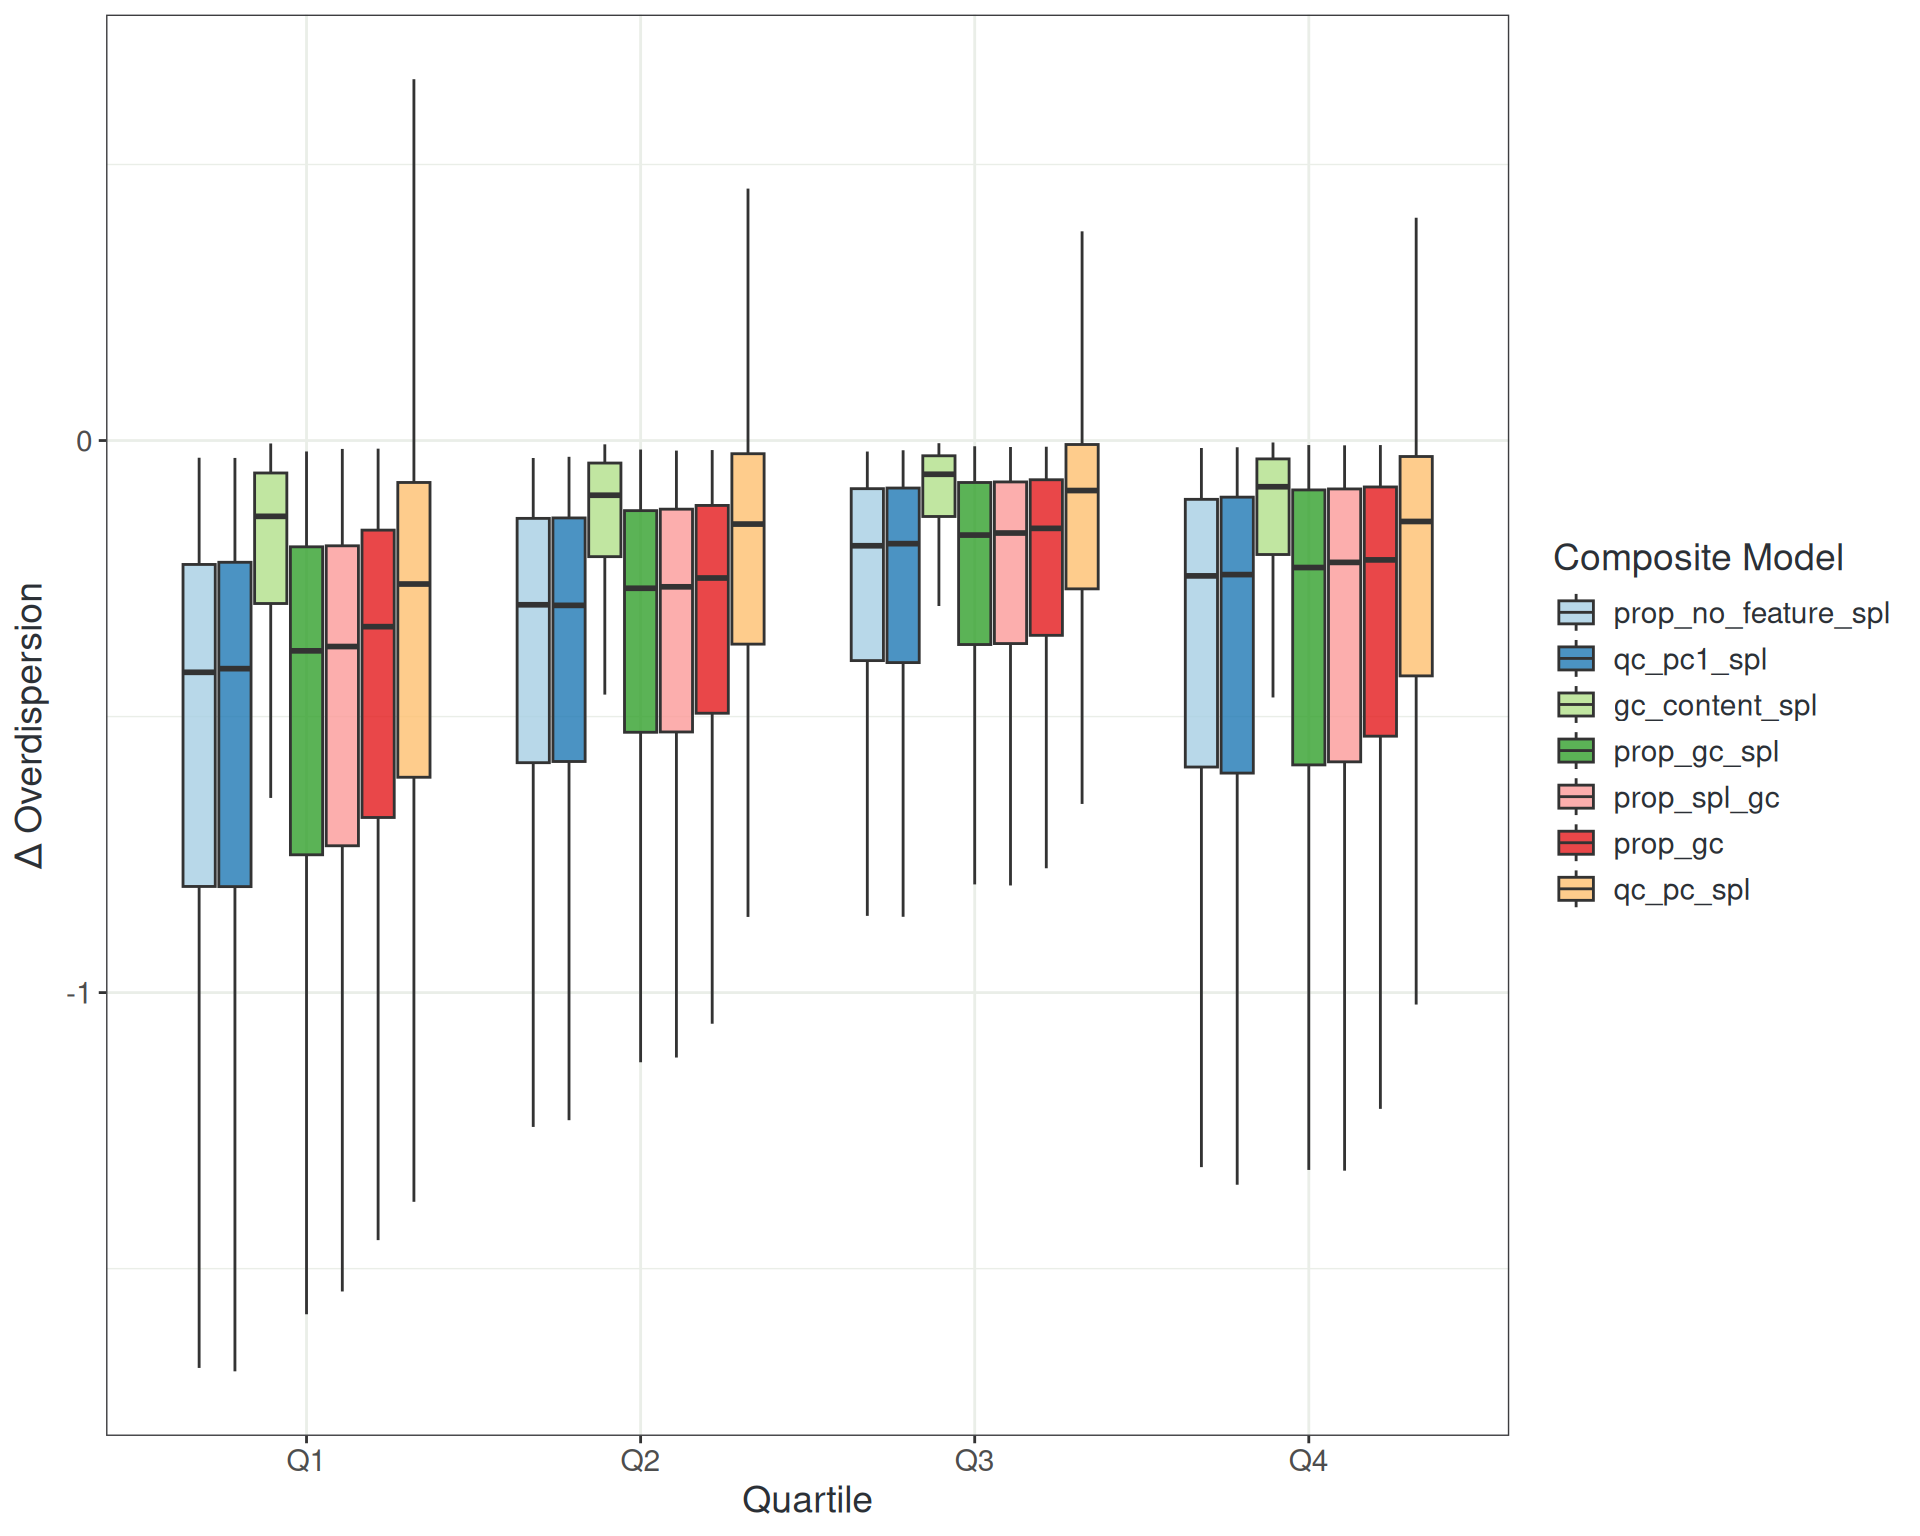
- No combination outperformed
prop_no_featureas a natural spline- Each predictor costs degrees of freedom
- Have also tested age as a predictor
- Natural spline is better than linear
- PC1 from genotype data improves about 30% of genes
Clickbait Time
Is large cohort transcriptomics just scRNA without the zero counts?
The questions are completely different:
- We want clusters of genes defining disease pathology with age + complication, NOT clusters of cells
- QC represents fundamentally different technical processes