Alternate References For Transcriptomics
Adelaide Bioinformatics Seminars
May 3, 2024
About Me
- Postdoctoral Fellow, Black Ochre Data Labs, Indigenous Genomics, Telethon Kids Institute
- 2020-2022: Dame Roma Mitchell Cancer Research Labs, University of Adelaide
- 2014-2020: Bioinformatics Hub, University of Adelaide
- 2008-2018: Slowest PhD Student in the world…
- Dec 2002: First used R &
limma
- 1st Year B.Sc. in 1986 \(\implies\) Dropped out in 1987


![]()
Bioconductor Package Developer


![]()
motifTestR
- Was adding motif enrichment testing to the GRAVI workflow
- Decided to avoid the MEME-Suite 🤯
- Plays badly with
conda - I struggle to interpret the results
- Not R native (although
memesdoes wrap some of it)
- Plays badly with
- Particularly interested in motif positions within a set of sequence
- Analogous to
centrimo
- Analogous to
- Added enrichment testing because I could
motifTestR: Positional Bias Plots
A <- top_matches %>%
  plotMatchPos(
    se = FALSE, abs = TRUE, linewidth = 1/2,
    binwidth = 5
  ) +
  labs(
    x = "Distance From Centre",
    y = "Proportion",
    colour = "Motifs In Cluster"
  ) +
  theme(legend.position = "none")
B <- top_matches %>%
  plotMatchPos(
    type = "cdf", geom = "line", abs = TRUE,
    linewidth = 1 / 2, binwidth = 1
  ) +
  labs(
    x = "Distance From Centre",
    y = "Proportion",
    colour = "Representative Motif"
  )
A + B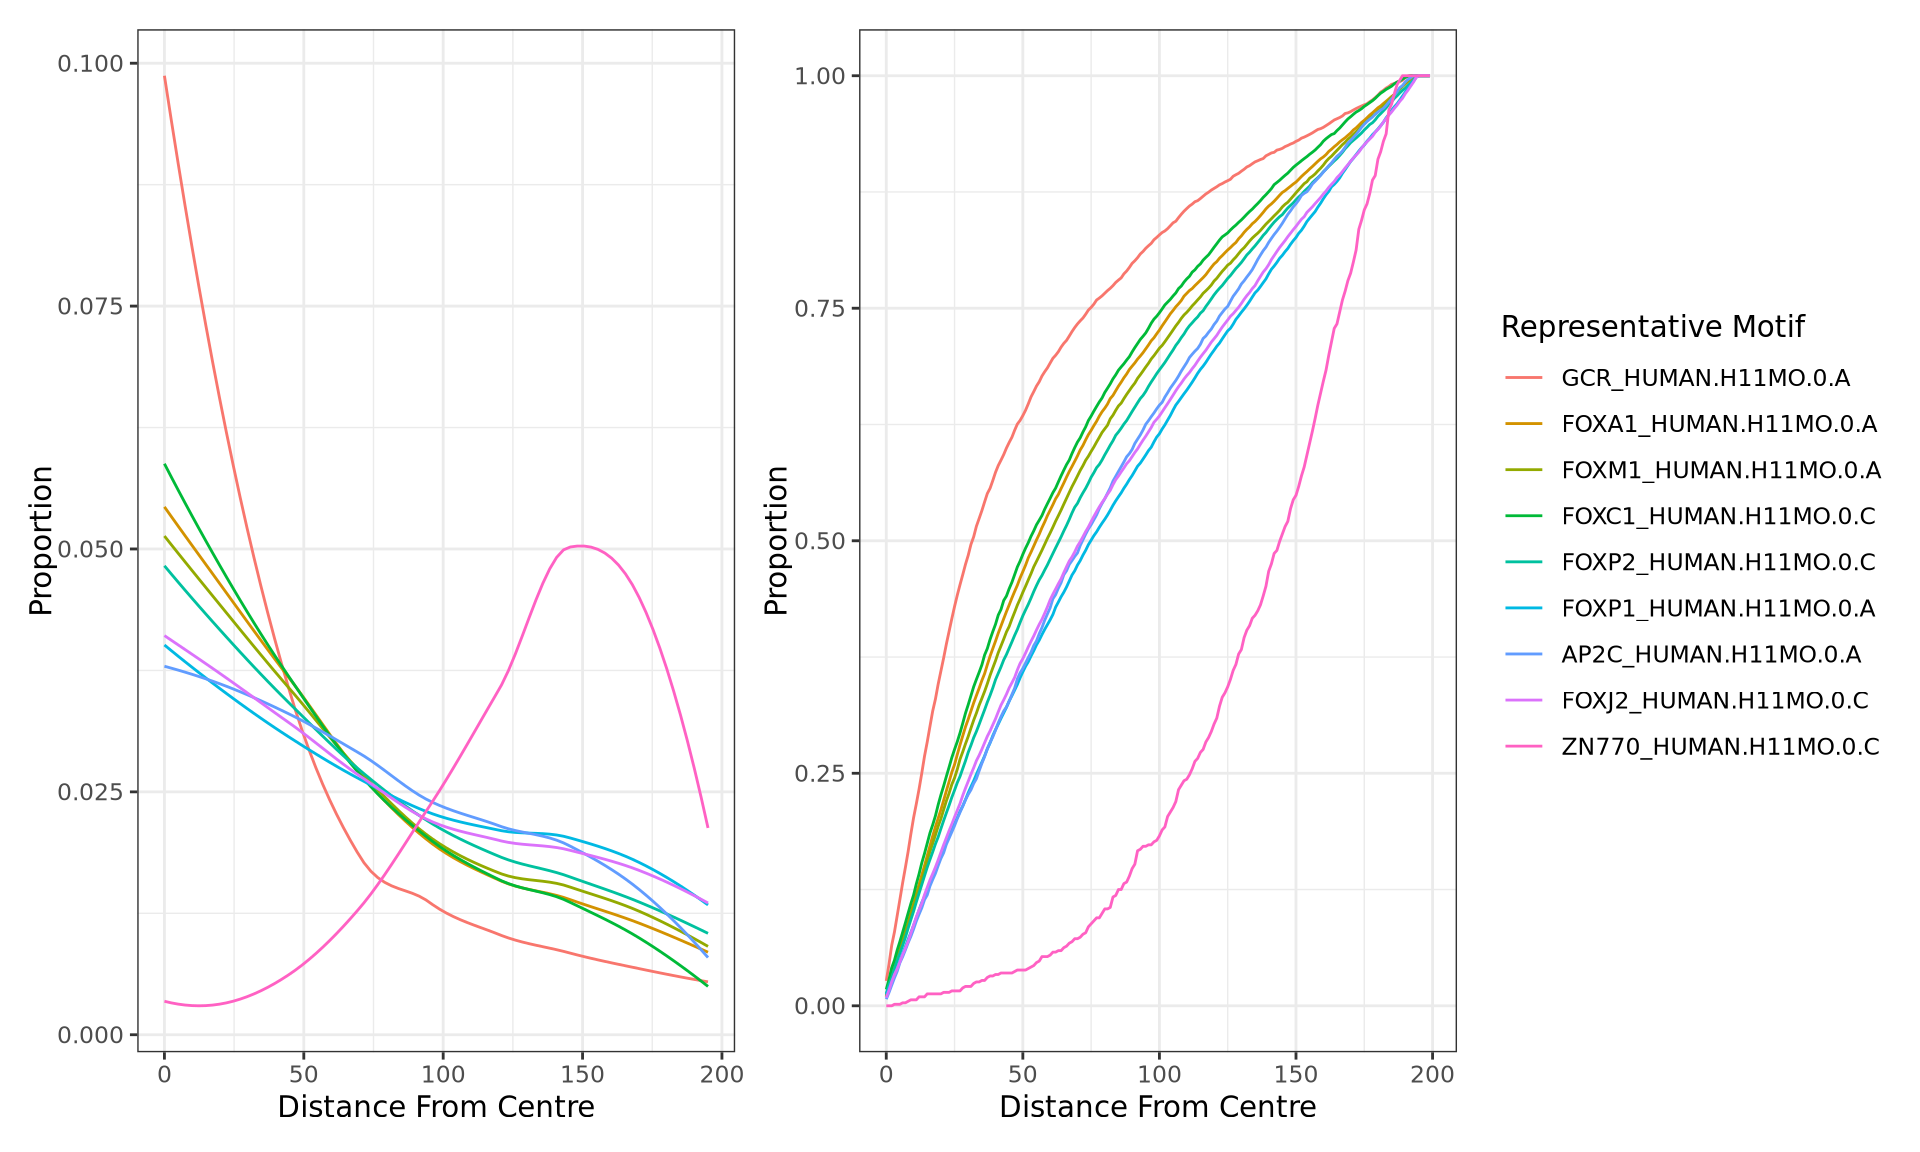
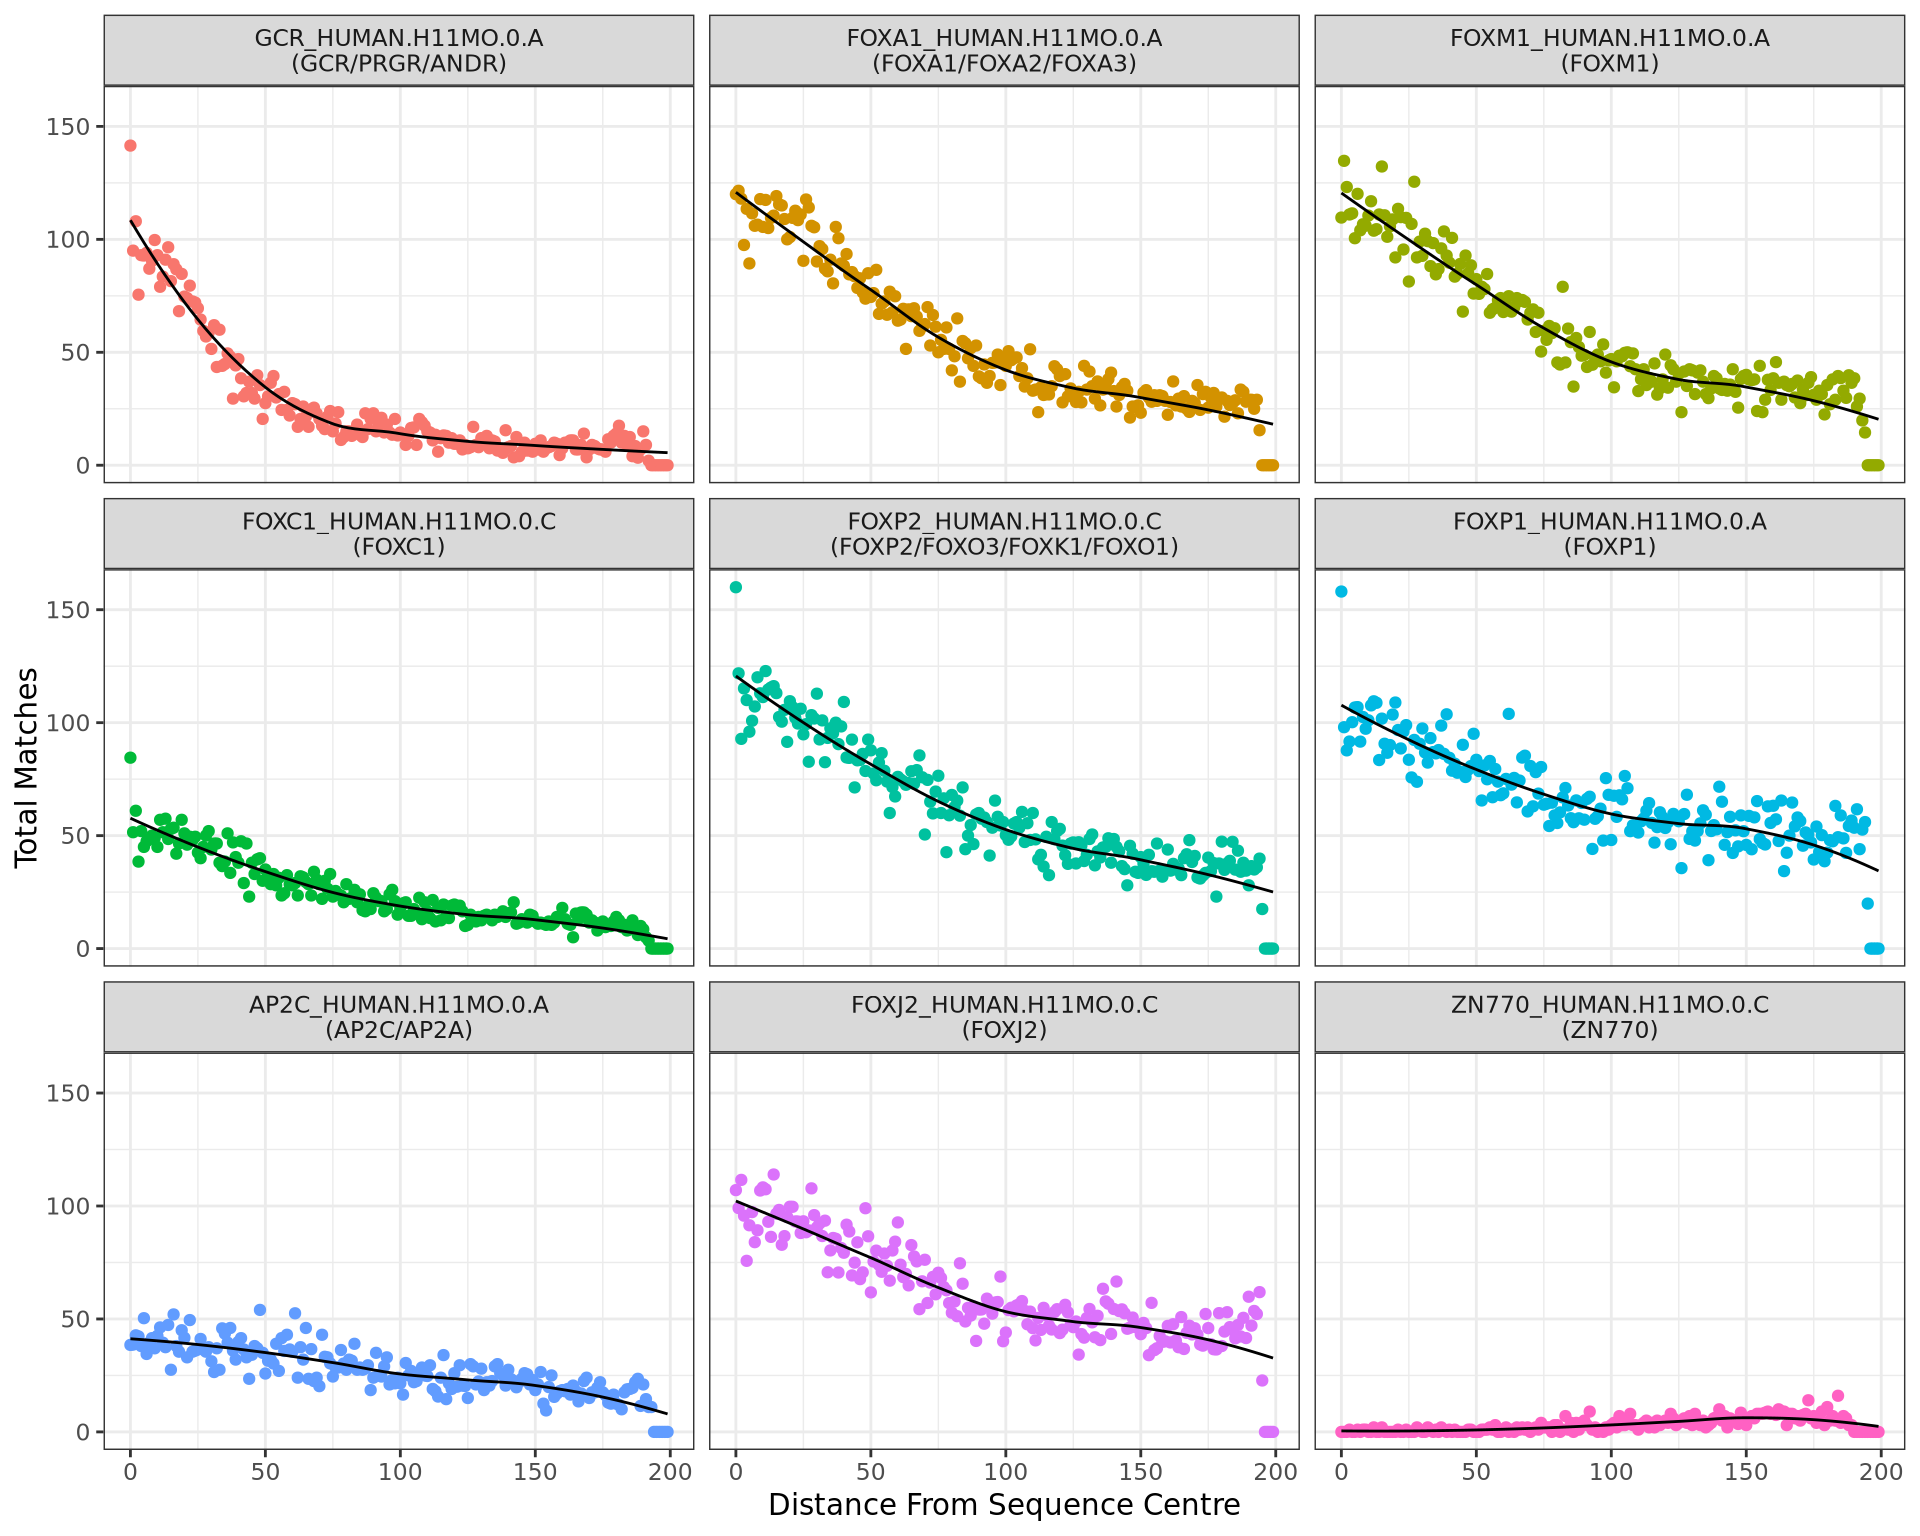
motifTestR: Positional Bias Plots
top_matches %>%
  plotMatchPos(
    geom = "point", abs =TRUE, use_totals = TRUE,
    binwidth = 1
  ) +
  geom_smooth(
    se = FALSE, colour = "black",
    linewidth = 1/2, method = 'loess'
  ) +
  facet_wrap(~name, labeller = as_labeller(lb)) +
  theme(legend.position = "none") +
  labs(
    x = "Distance From Sequence Centre",
    y = "Total Matches"
  )
Show the matches at each position
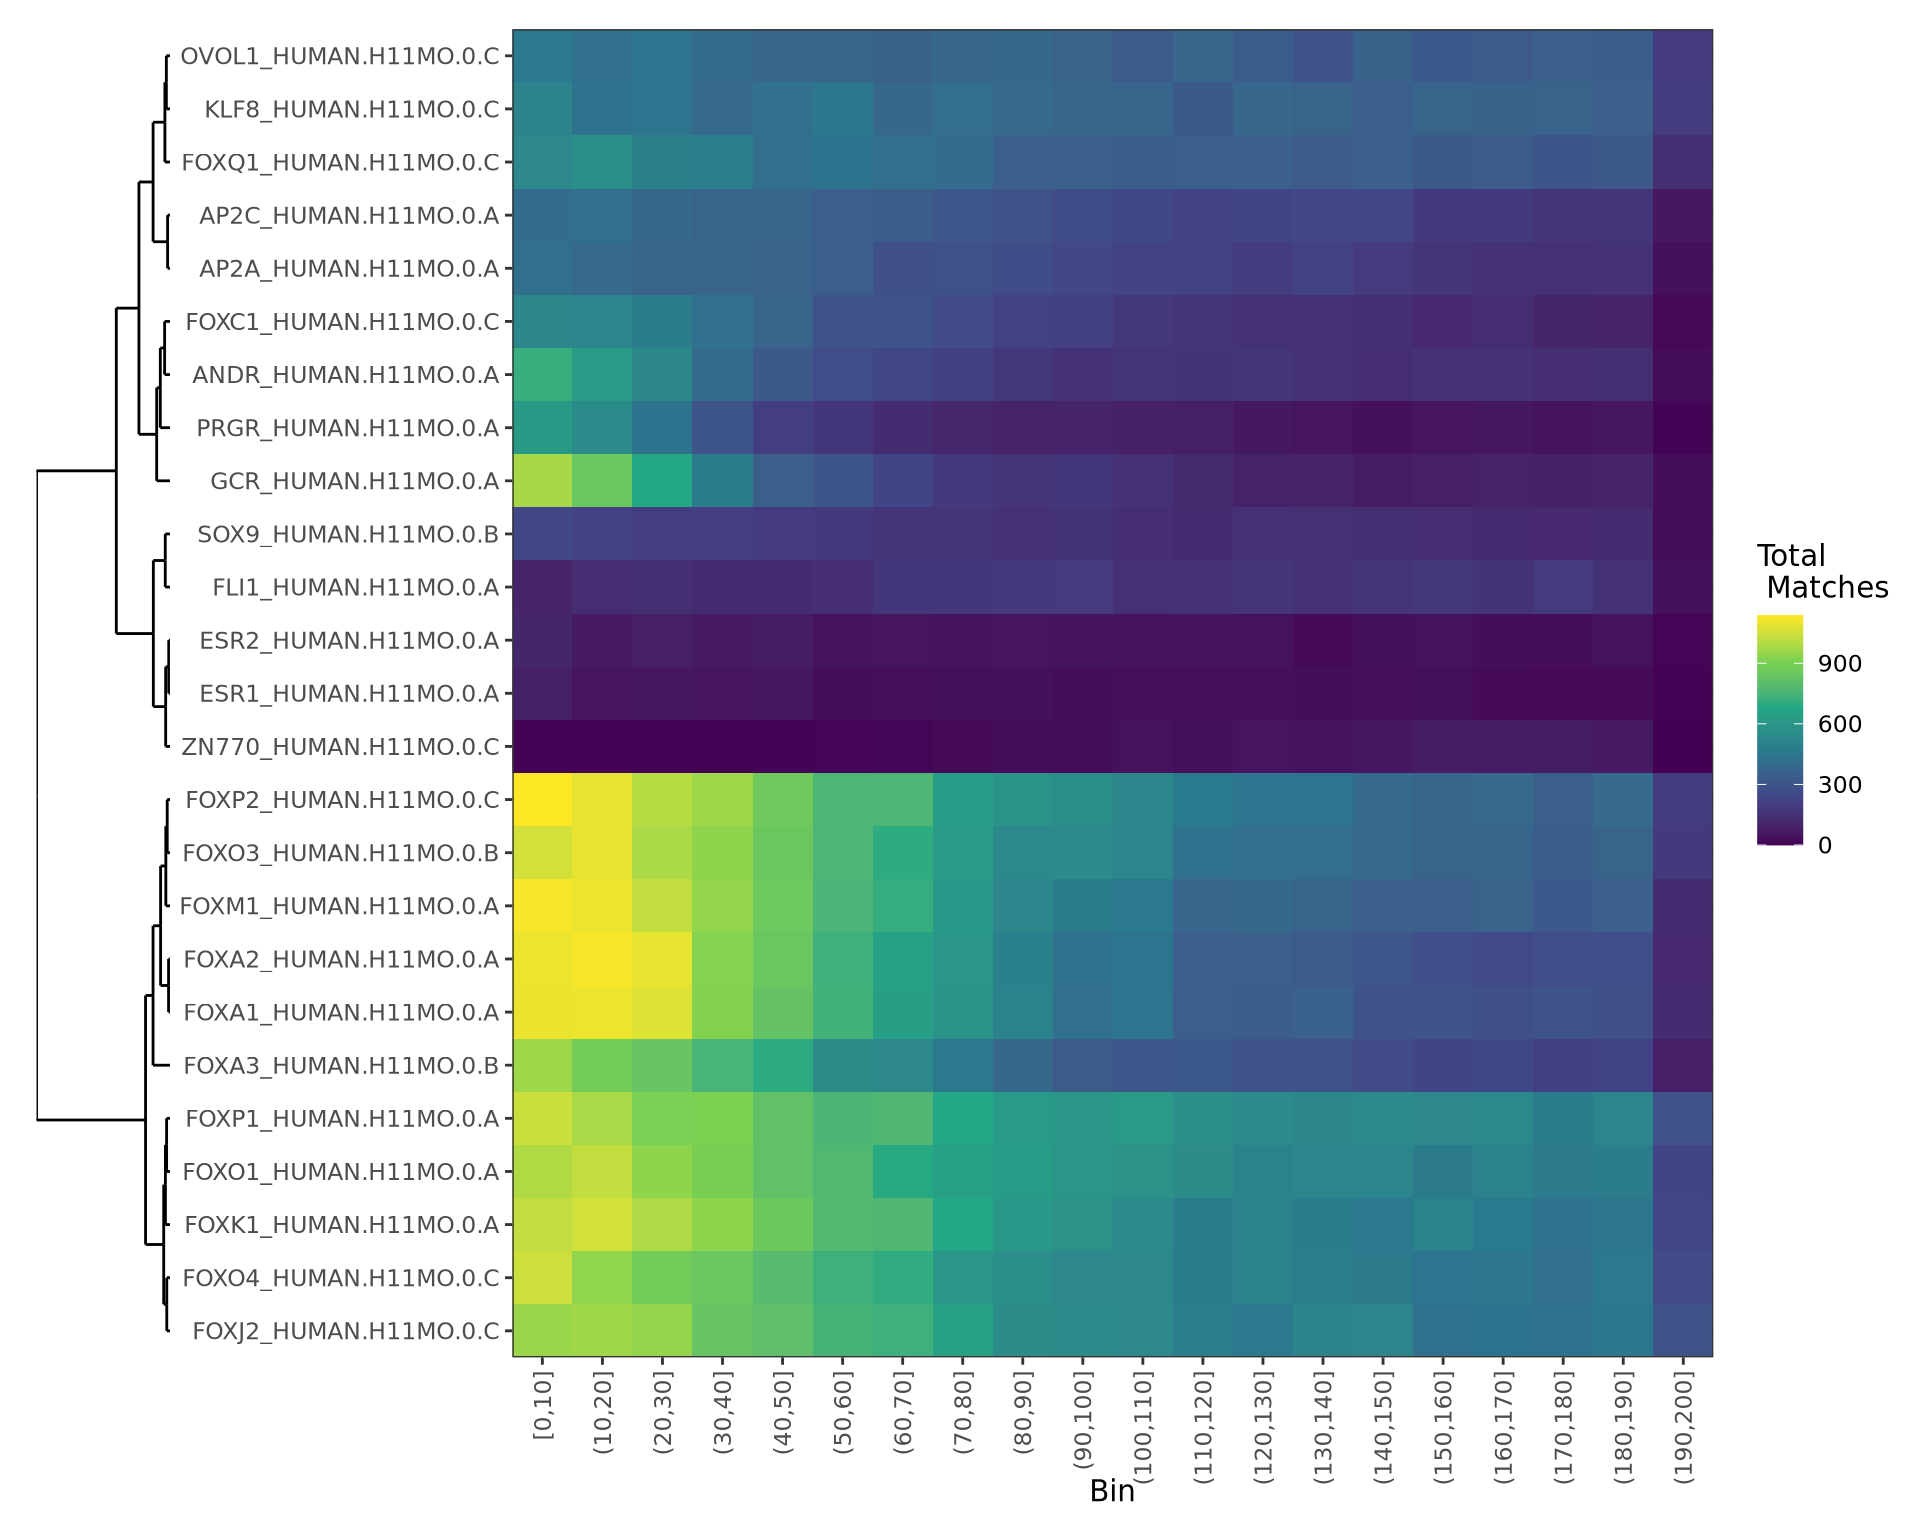
motifTestR: Positional Bias Plots
motif_list %>%
    dplyr::filter(altname %in% top_pos) %>%
    to_list() %>%
    getPwmMatches(
      fw_seq, abs = TRUE, best_only = TRUE,
      mc.cores = threads
    ) %>%
    plotMatchPos(
      abs = TRUE, type = "heatmap",
      cluster = TRUE, use_totals = TRUE,
      binwidth = 10
    ) +
    labs(
    x = "Bin", fill = "Total\n Matches"
)- Clustering & heatmaps can help identify redundancy
- Useful for larger sets of motifs / matches
Life Expectancy Gaps
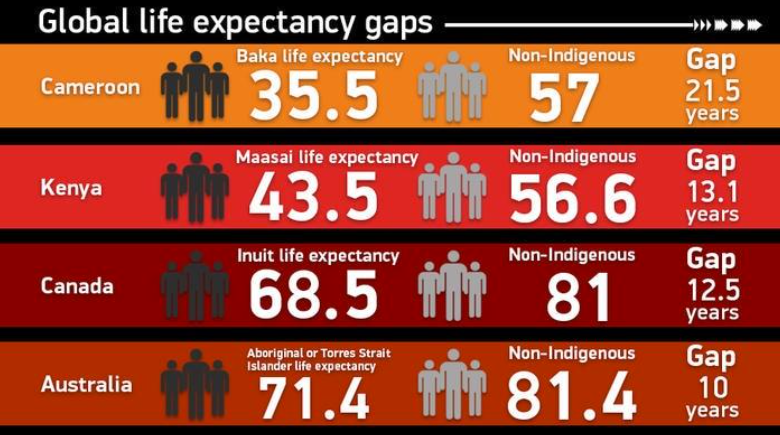
Courtesy of A/Prof Jimmy Breen, Black Ochre Data Labs, TKI
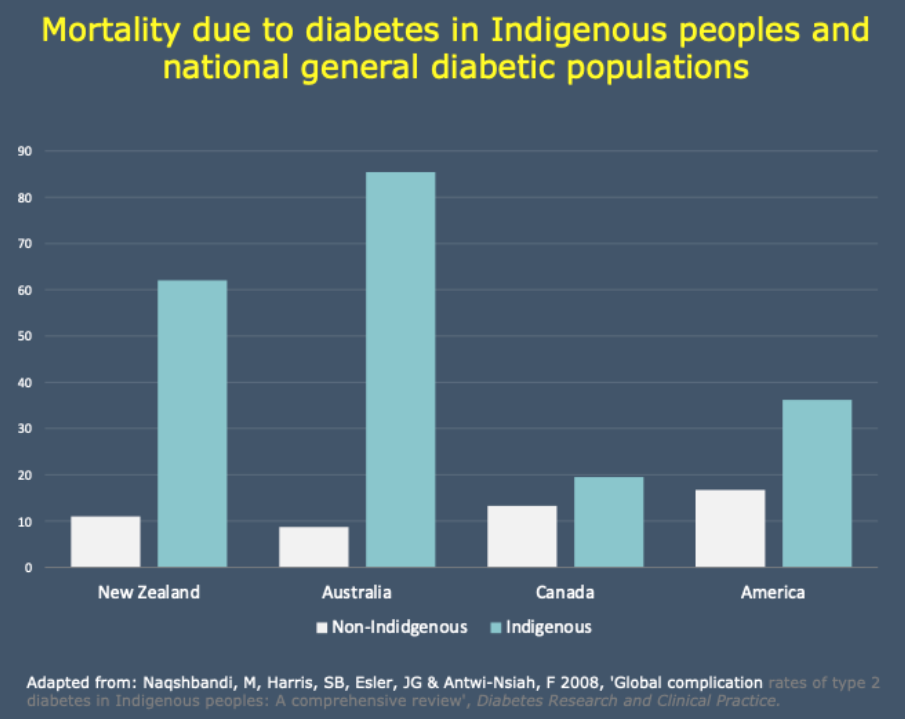
Mortality From Diabetes
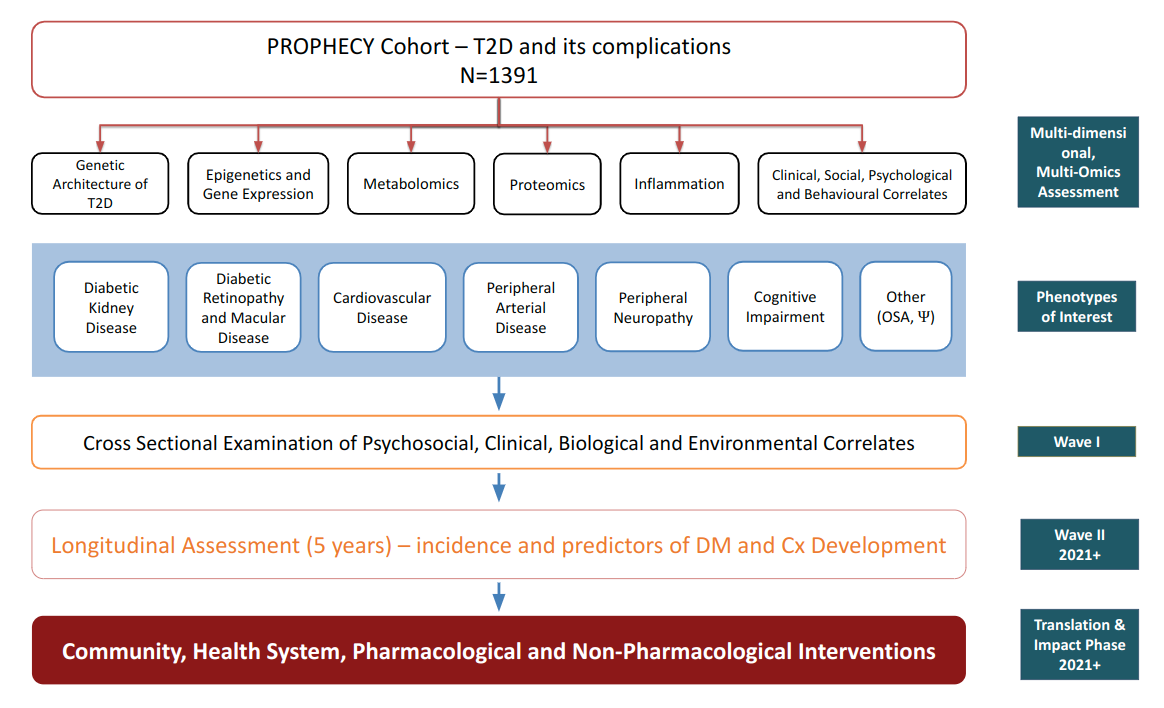
Multi-Omic Approaches
Transcript-Level Analysis
salmonprovides transcript-level counts with overdispersion estimates!- Can we modify a reference transcriptome using a set of variants?
The Variants
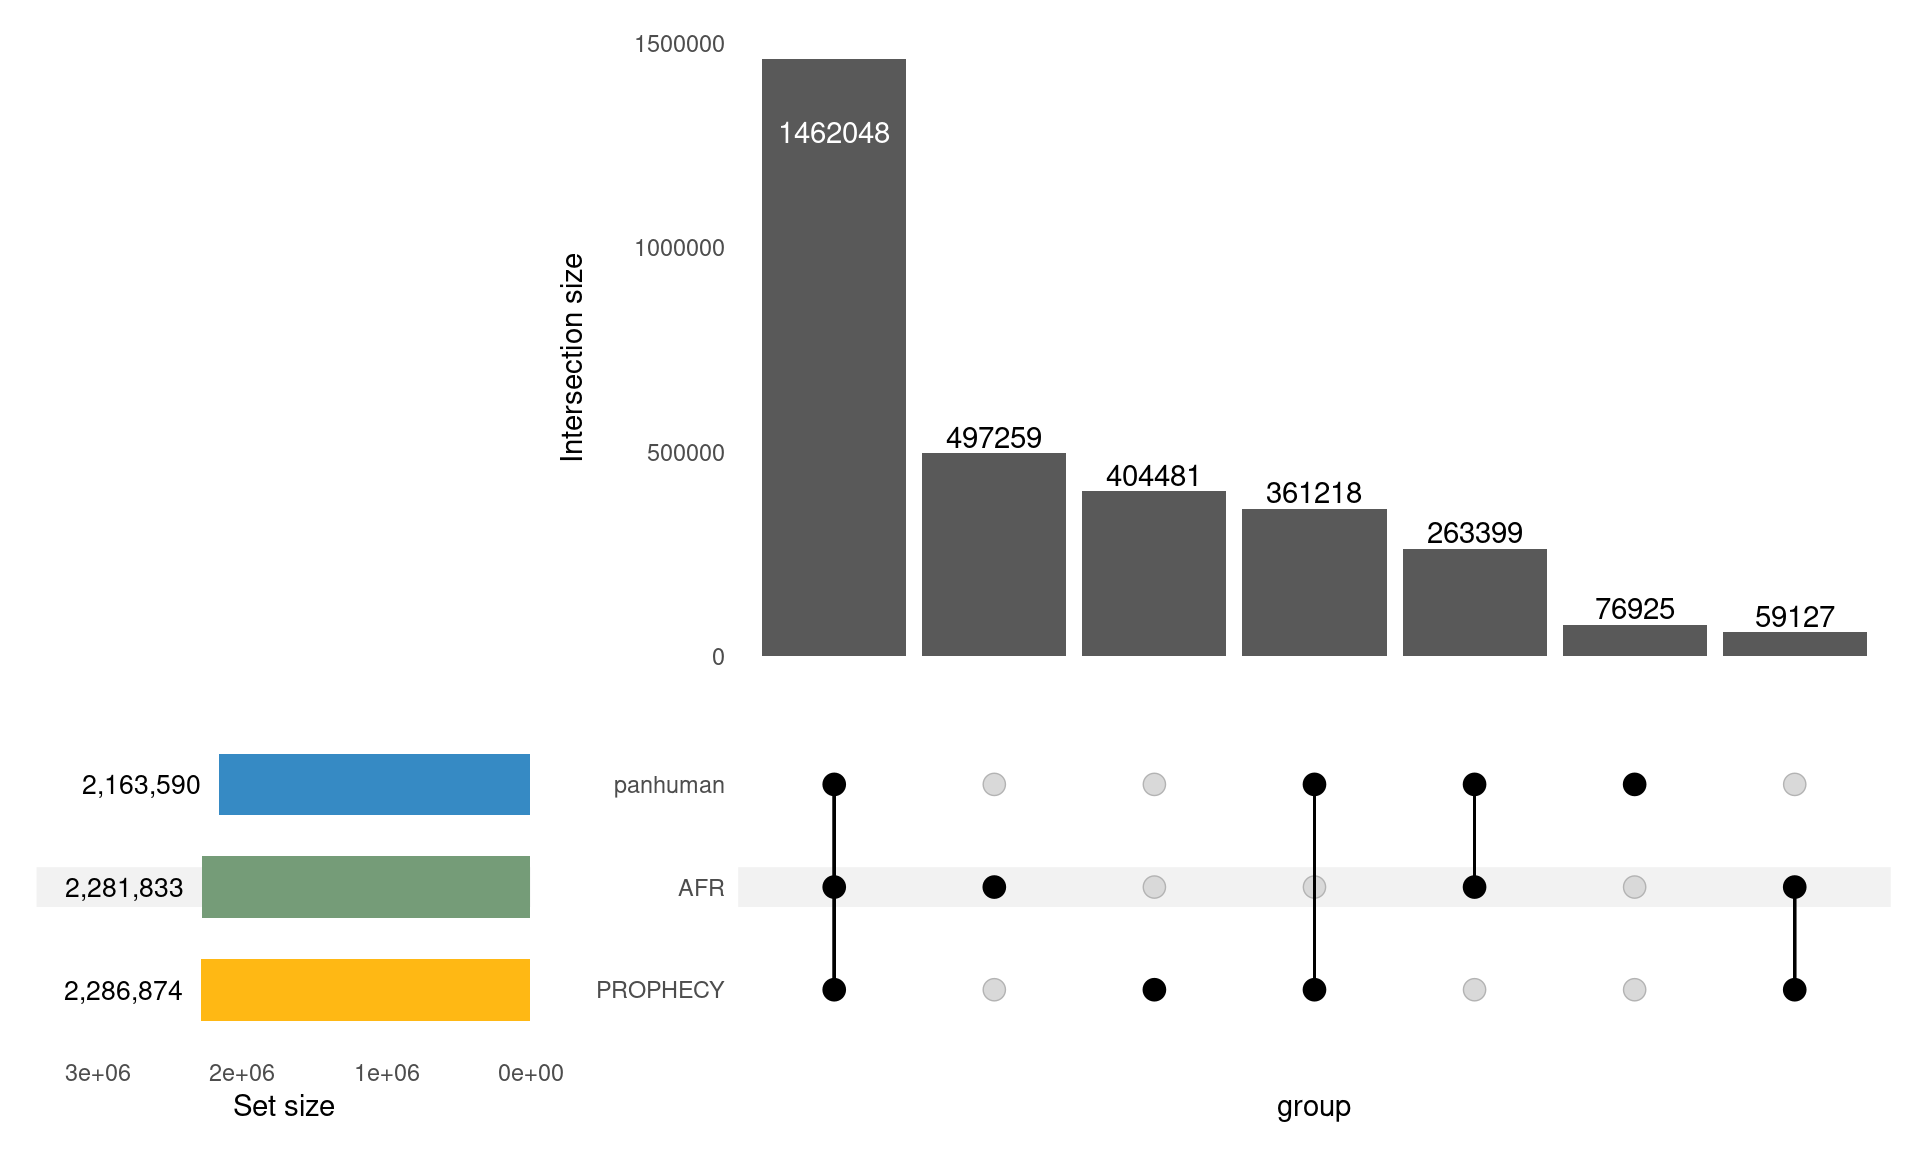
PROPHECY Variants Overlapping Exons
Uniquely Aligning Reads (STARconsensus)
However…
- About 1 in 300 reads moves
- About 30-40,000 reads remain uniquely aligned but in a different location
- How much is noise?
- Are the changes shared between samples?
- Do the changed reads overlap a variant?
- Where exactly are they moving from and to?
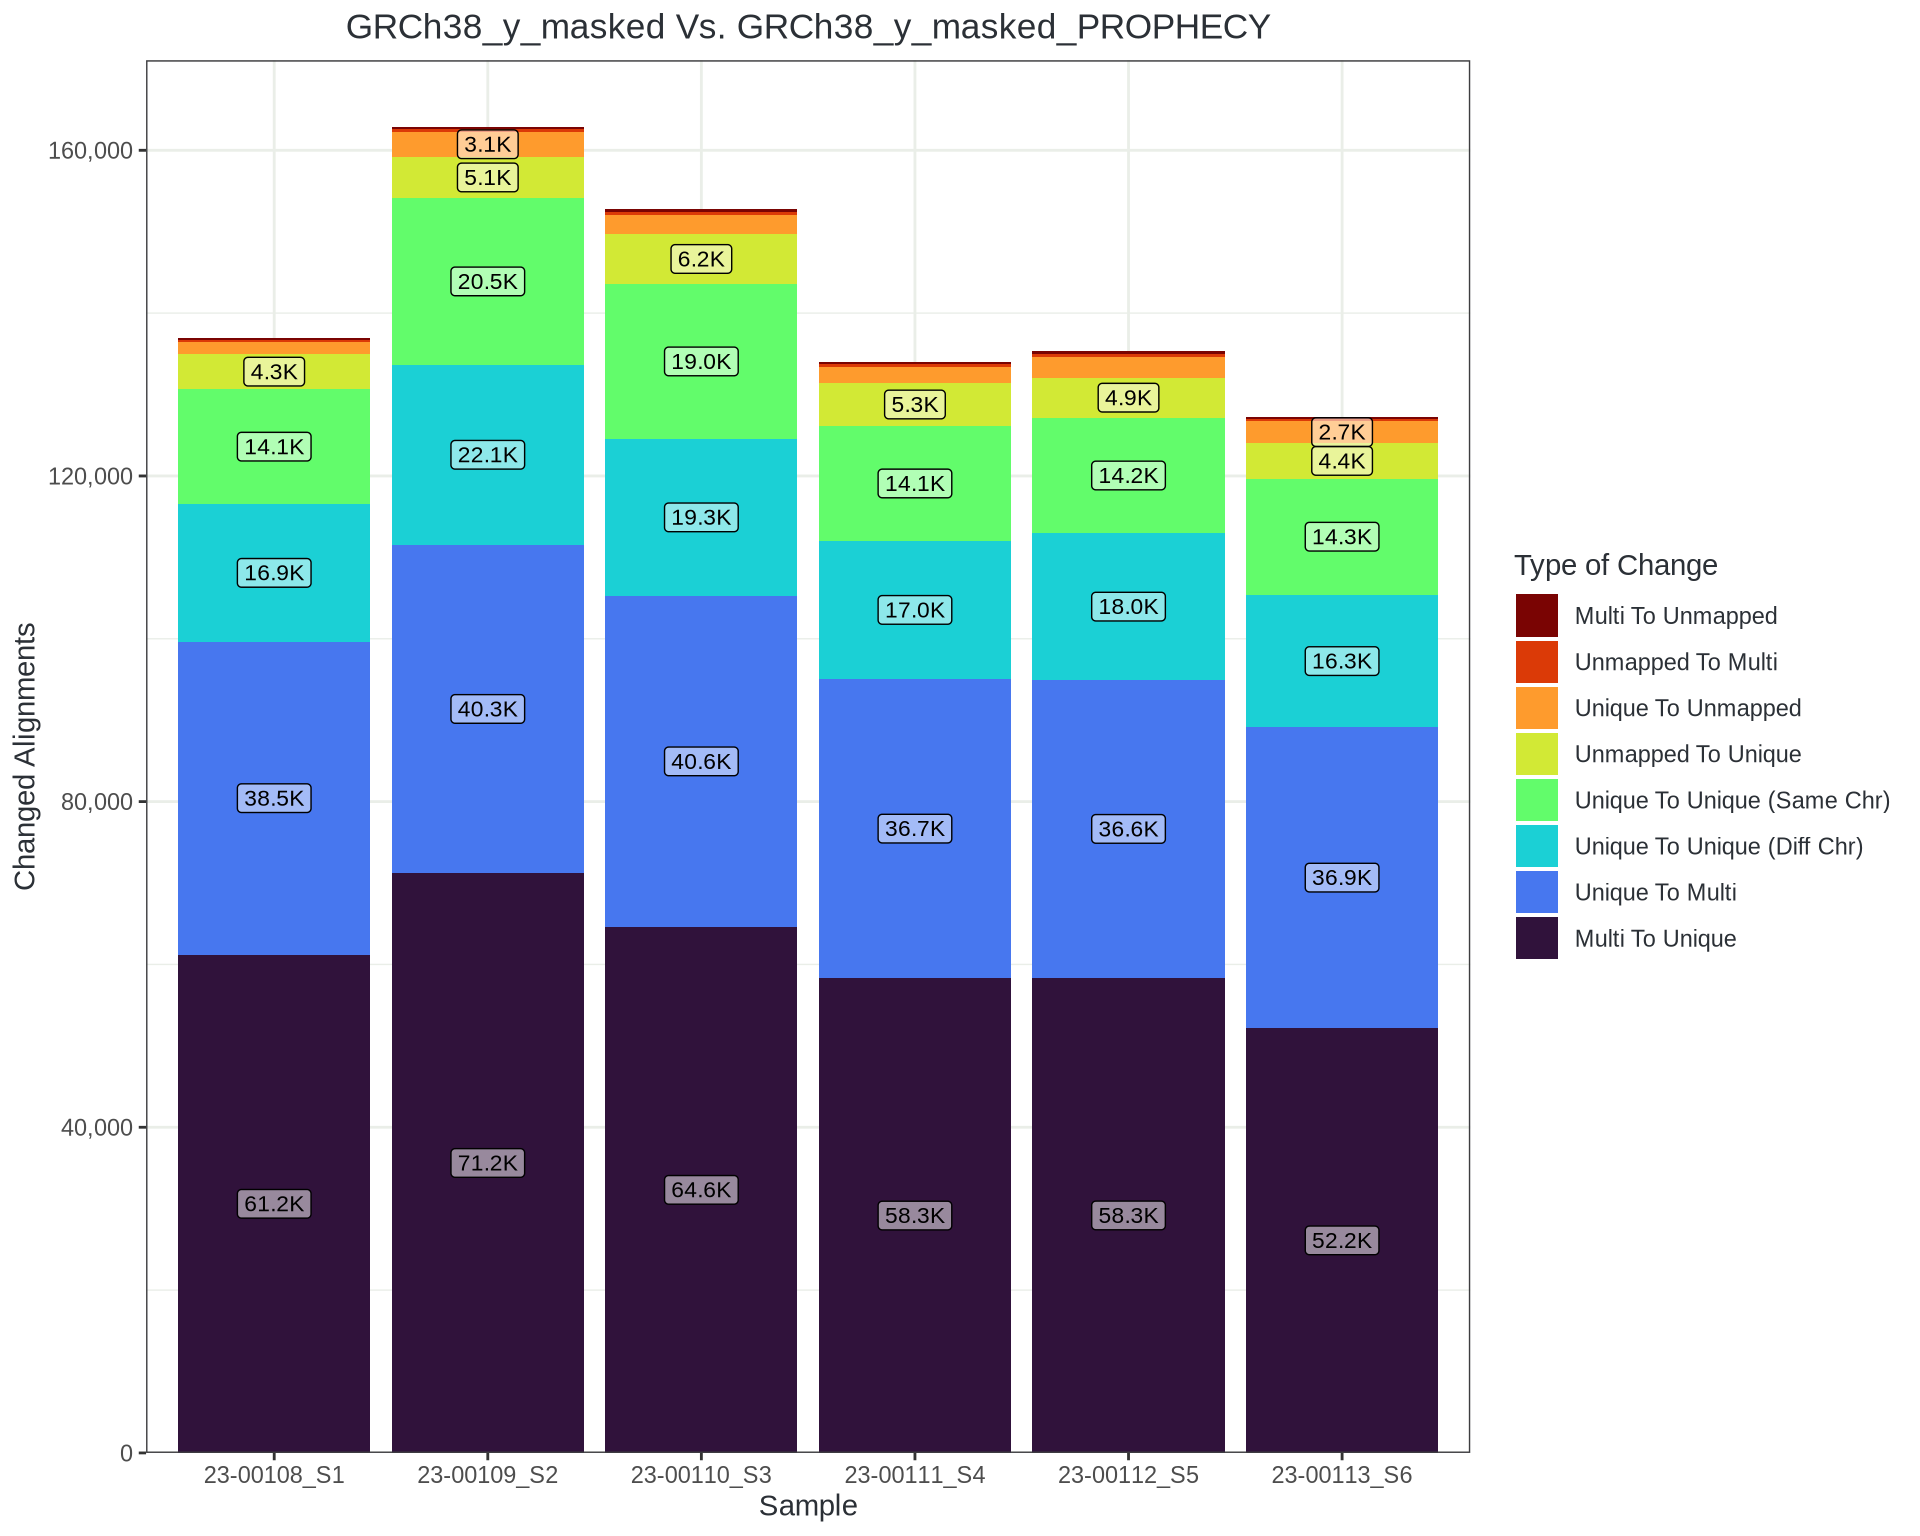
Reads Overlapping Variants
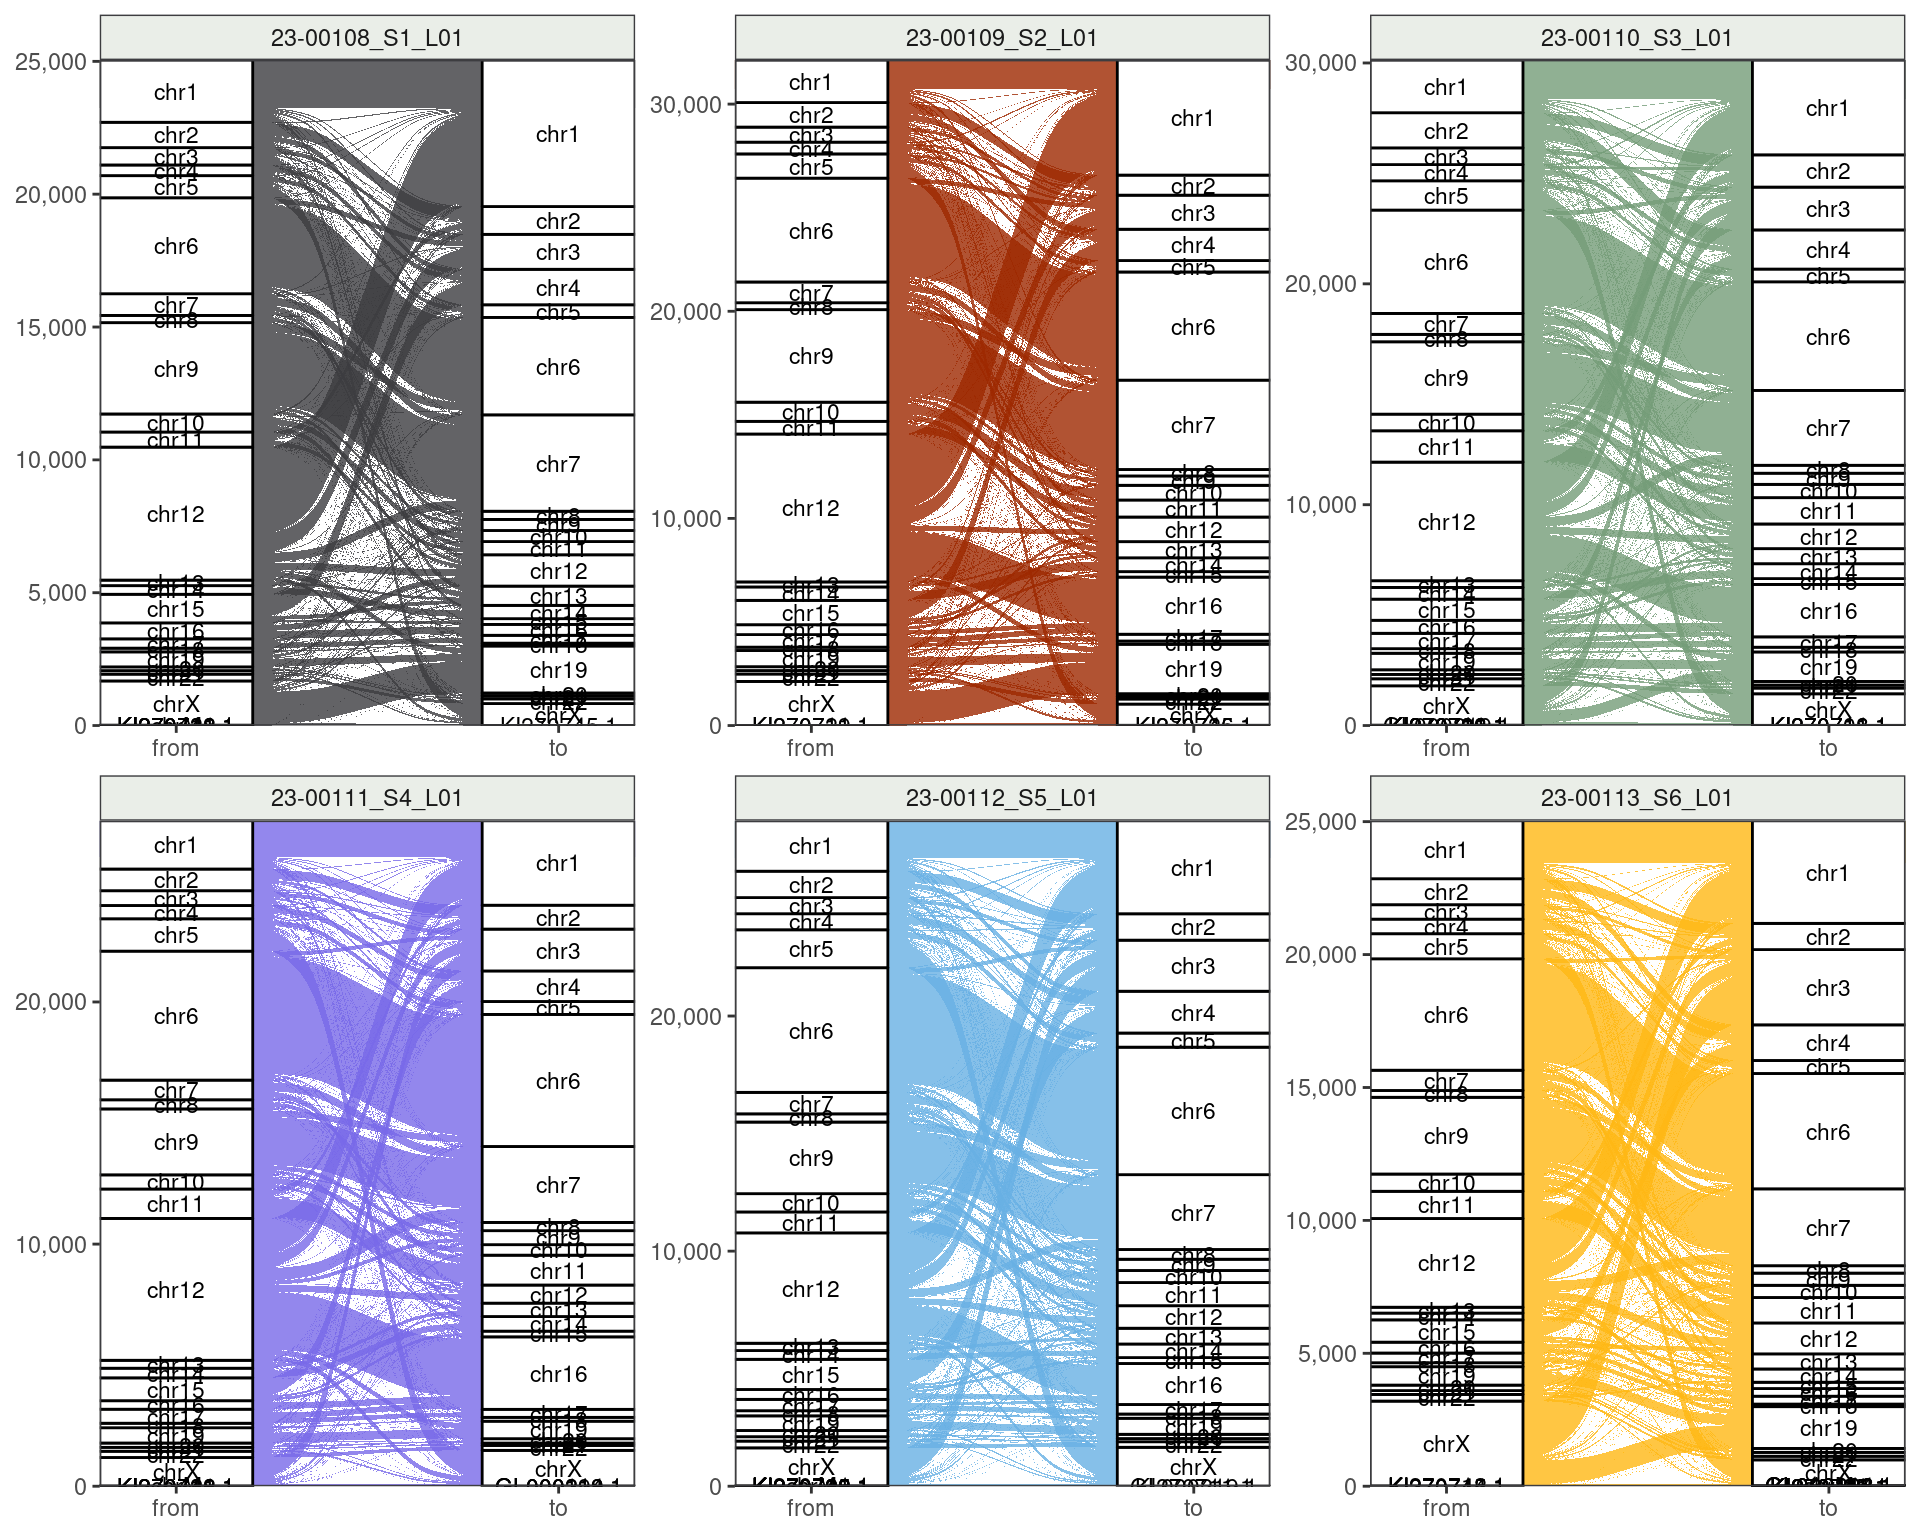
Taking reads where gapped alignments overlap a variant
- chr12 to chr1 shared by all
- Also chr9 to chr7
- chrX to chr19 shared by 1, 2, 6
- chr12 to chr16 shared by 2 \(\rightarrow\) 5
Reads Overlapping Variants
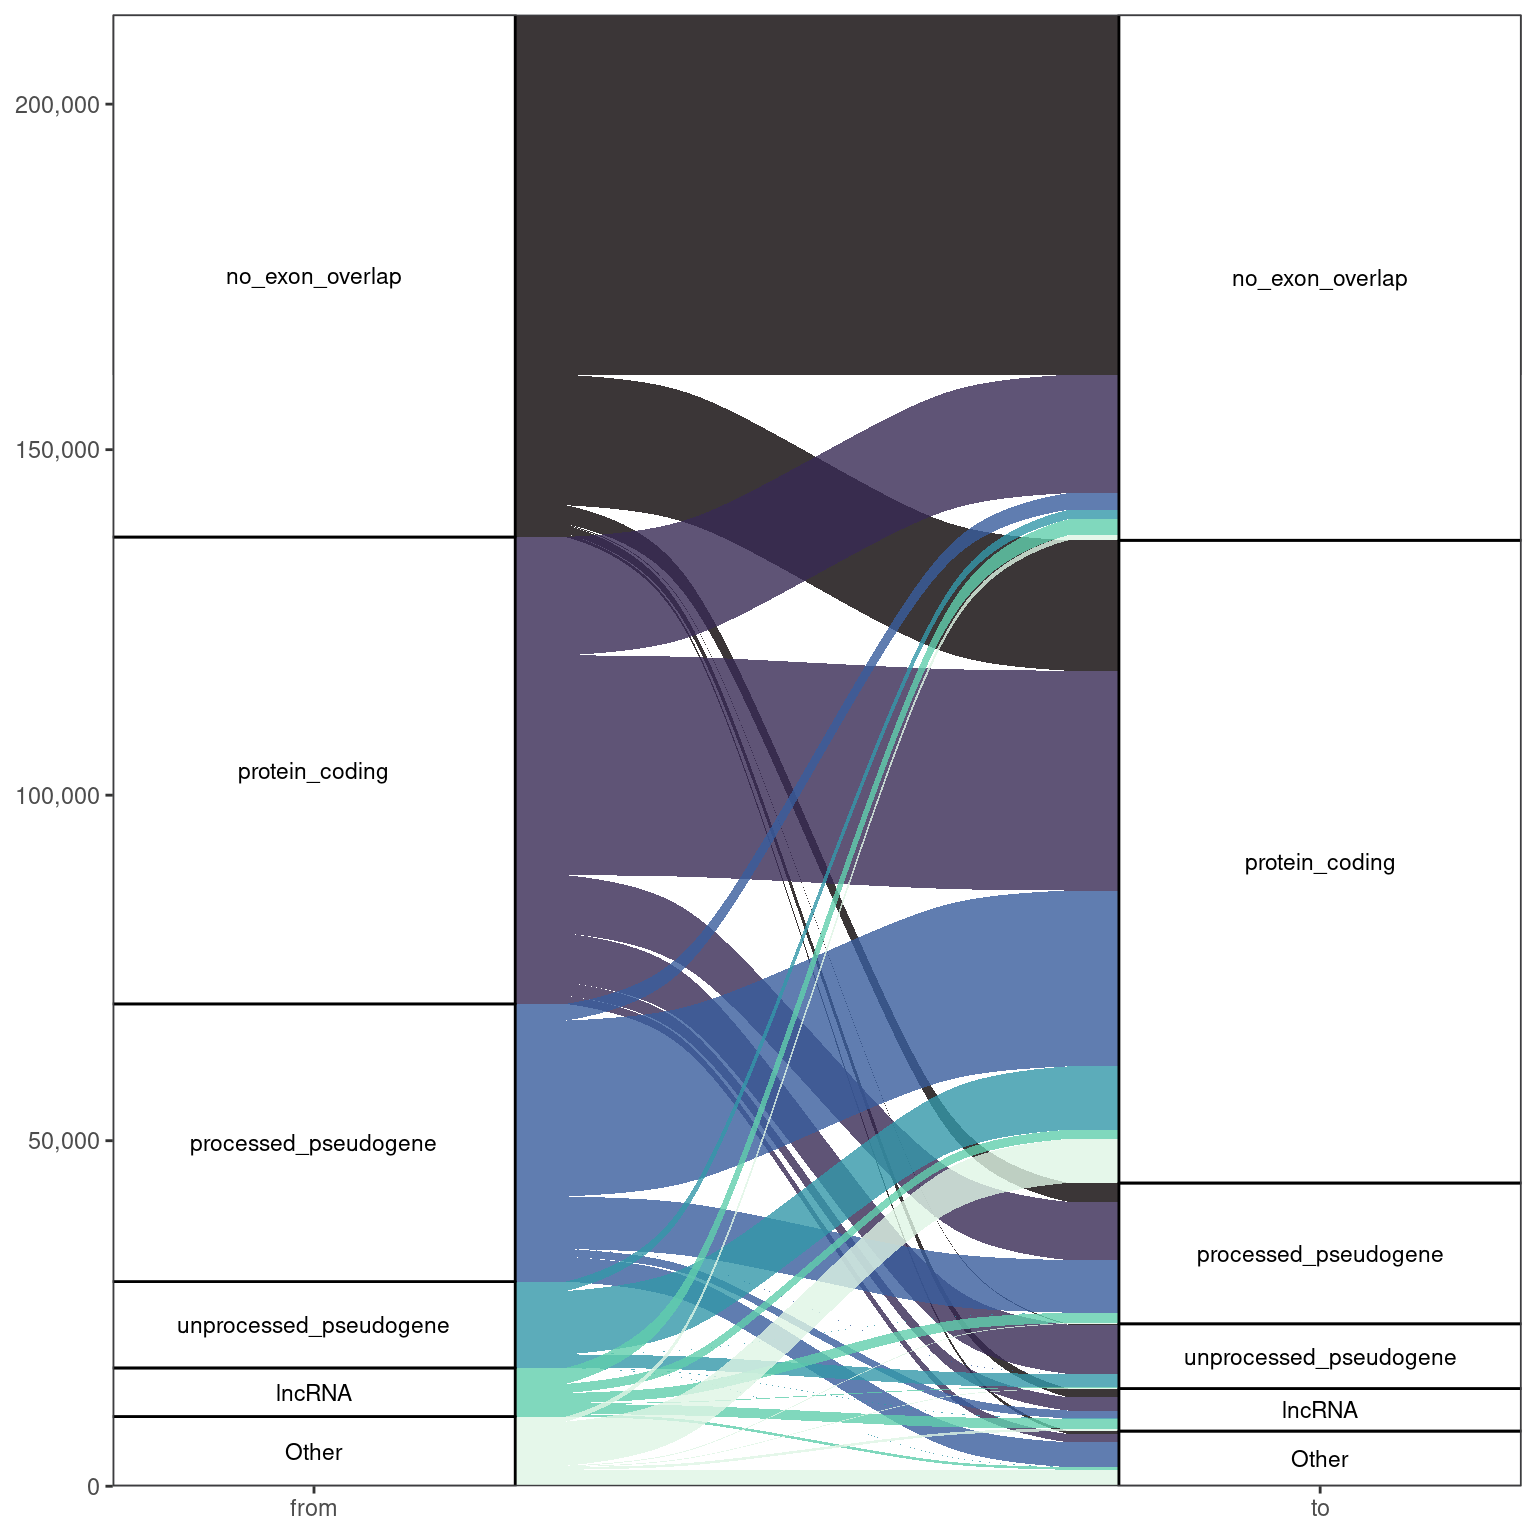
Taking all samples combined
- Increase in alignments to protein coding genes
- Decrease in pseudogenes
Common Genes Being Impacted
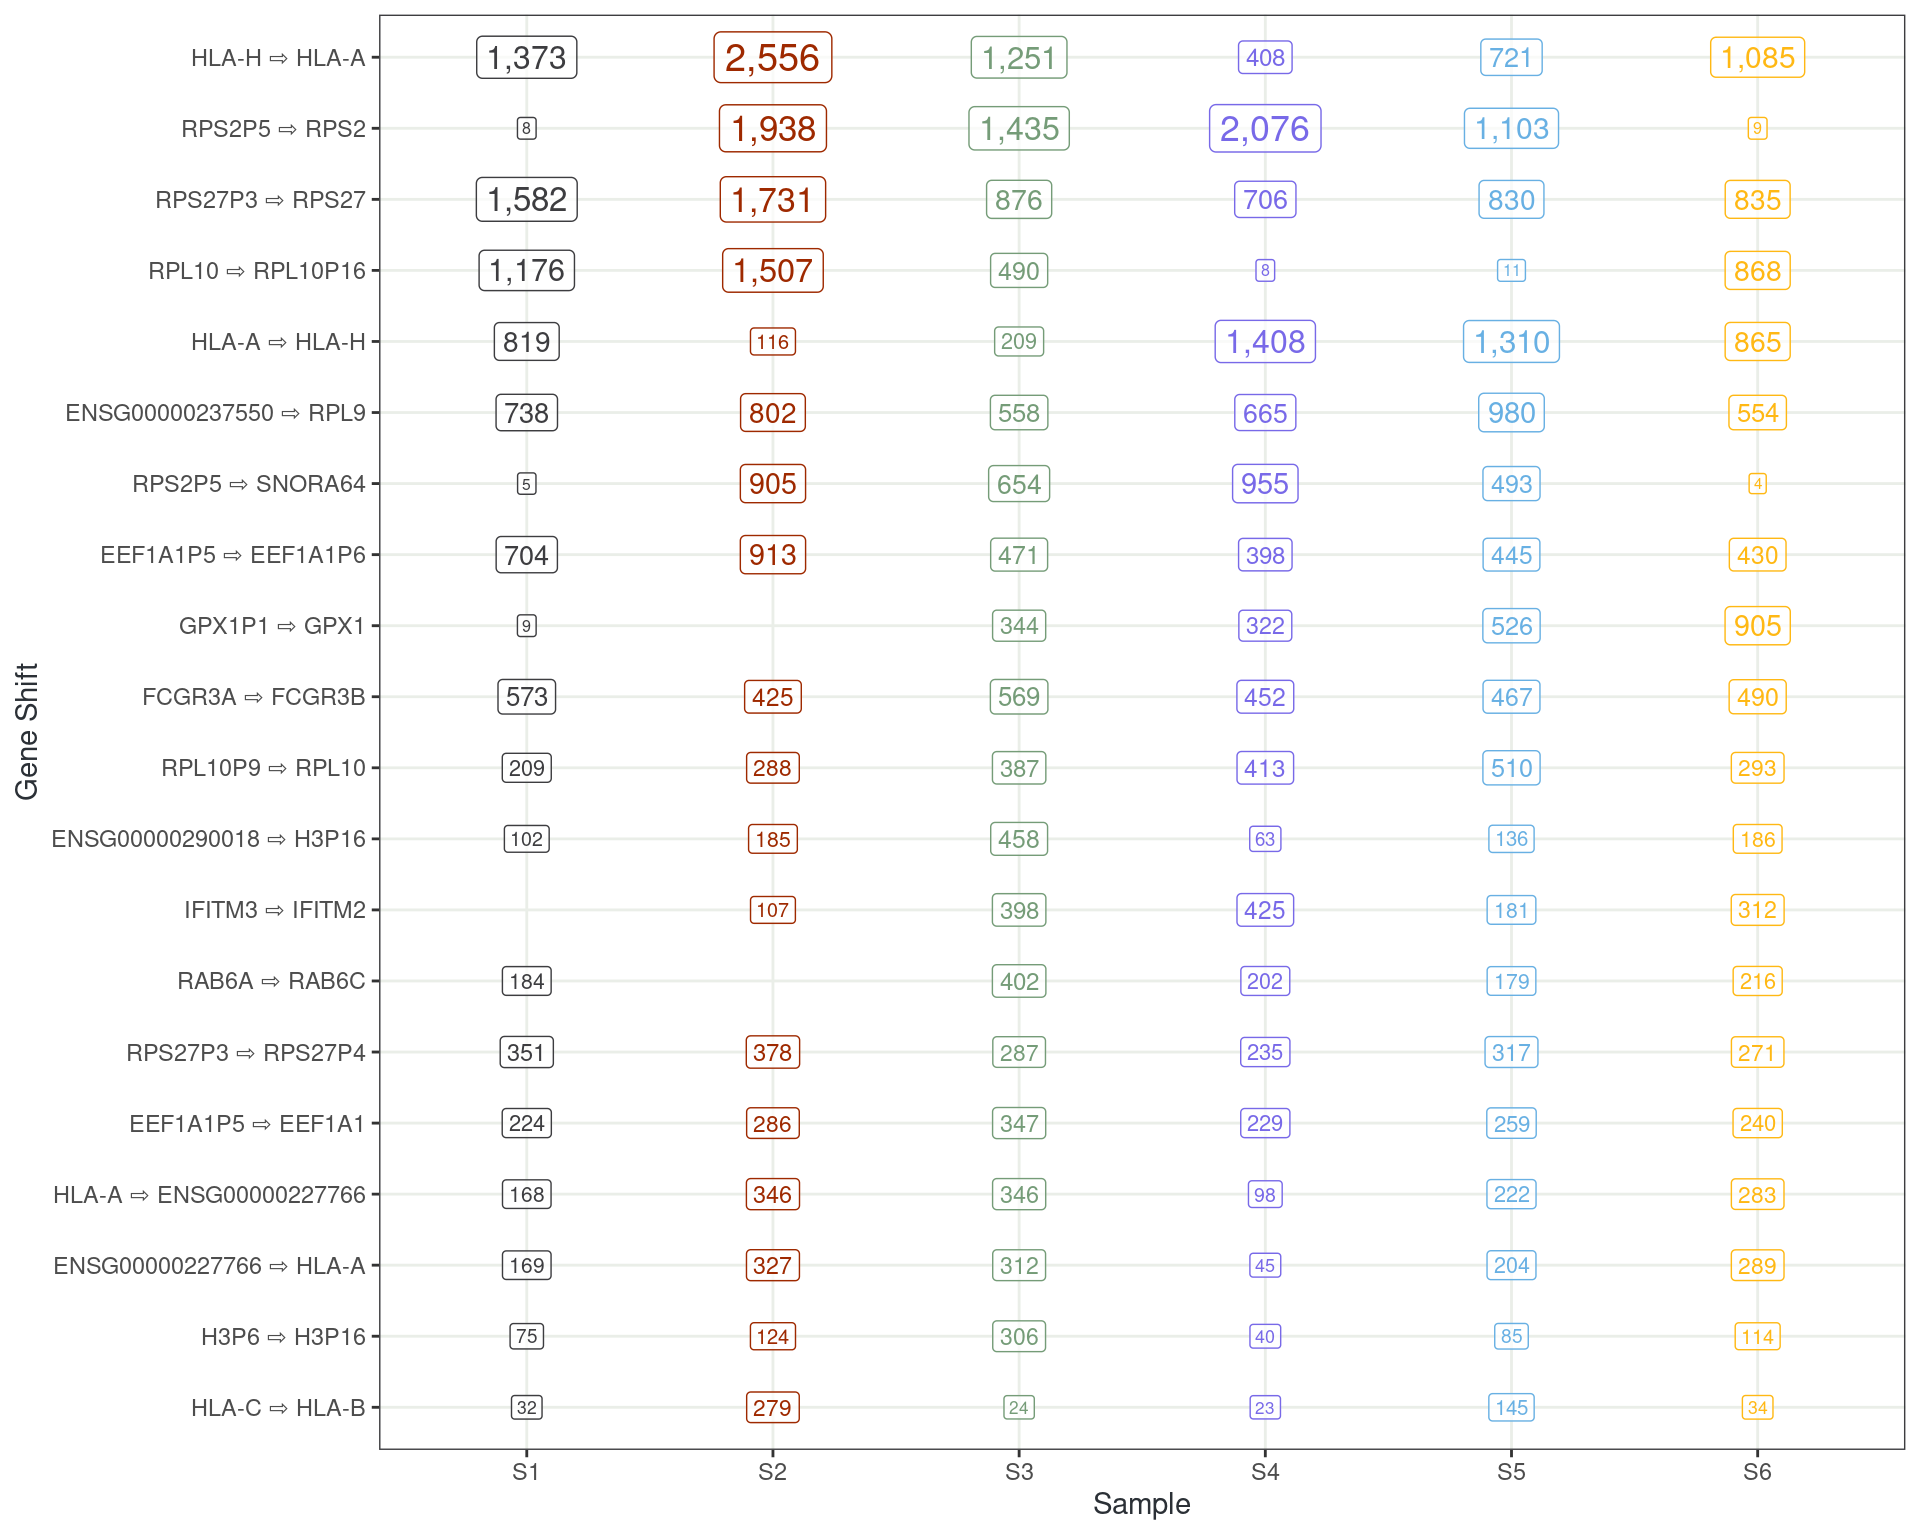
Taking the 20 most common shifts
- HLA-A
- HLA-H
- Ribosomal proteins
- Histone Proteins
Differential Gene Expression Analysis
- GRCh38 vs PROPHECY-modified
- Identical input reads
- All changes are alignment induced
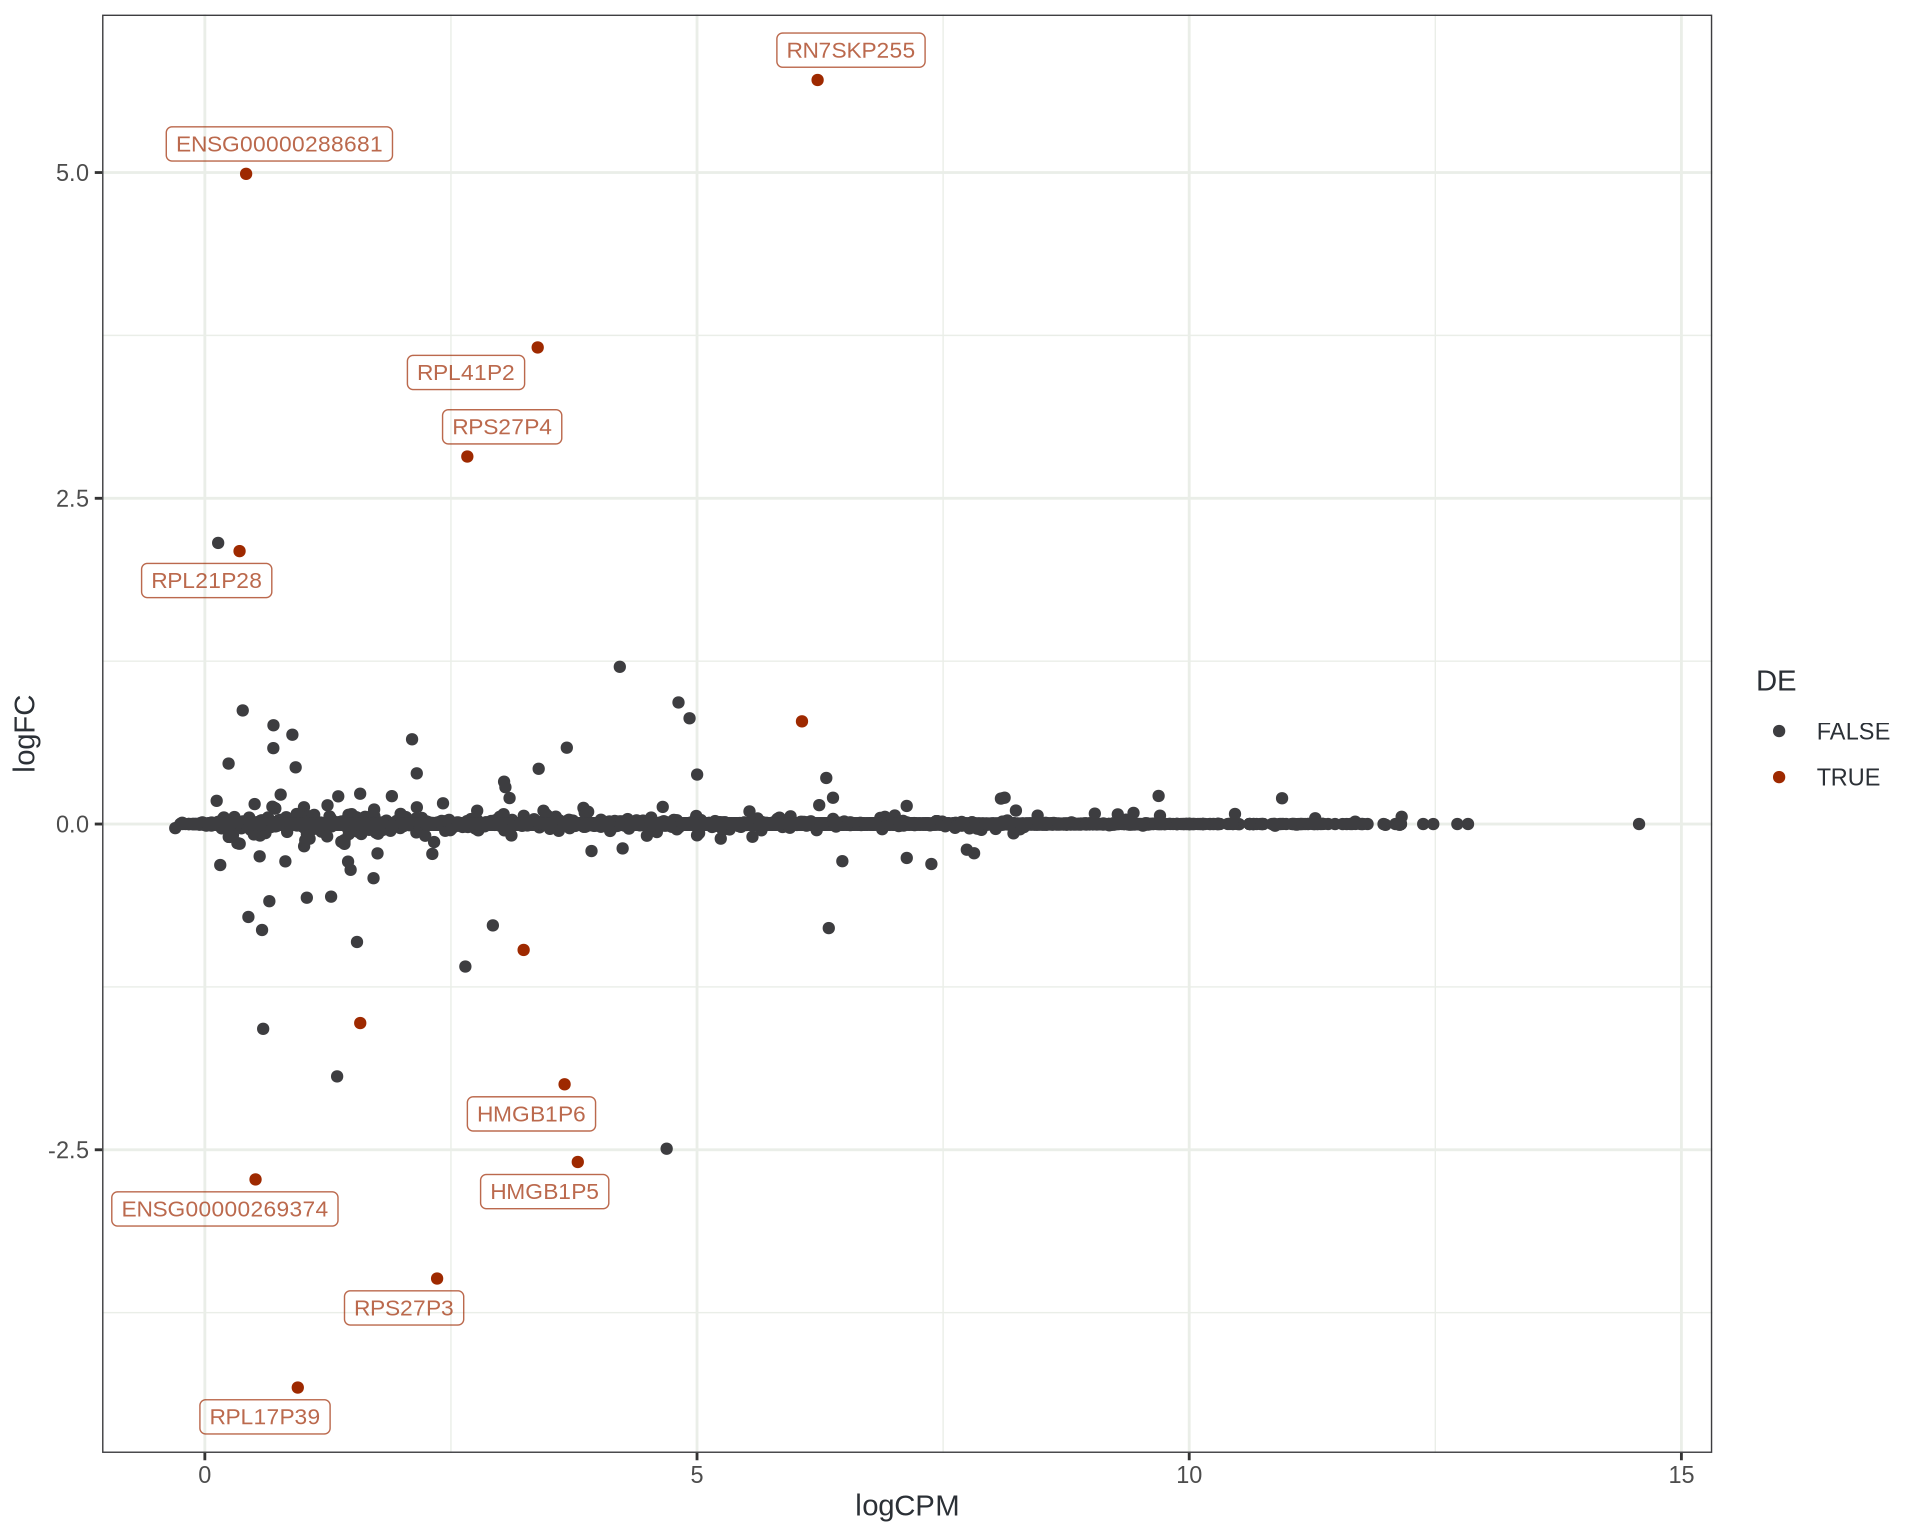
Genes Impacted Variably
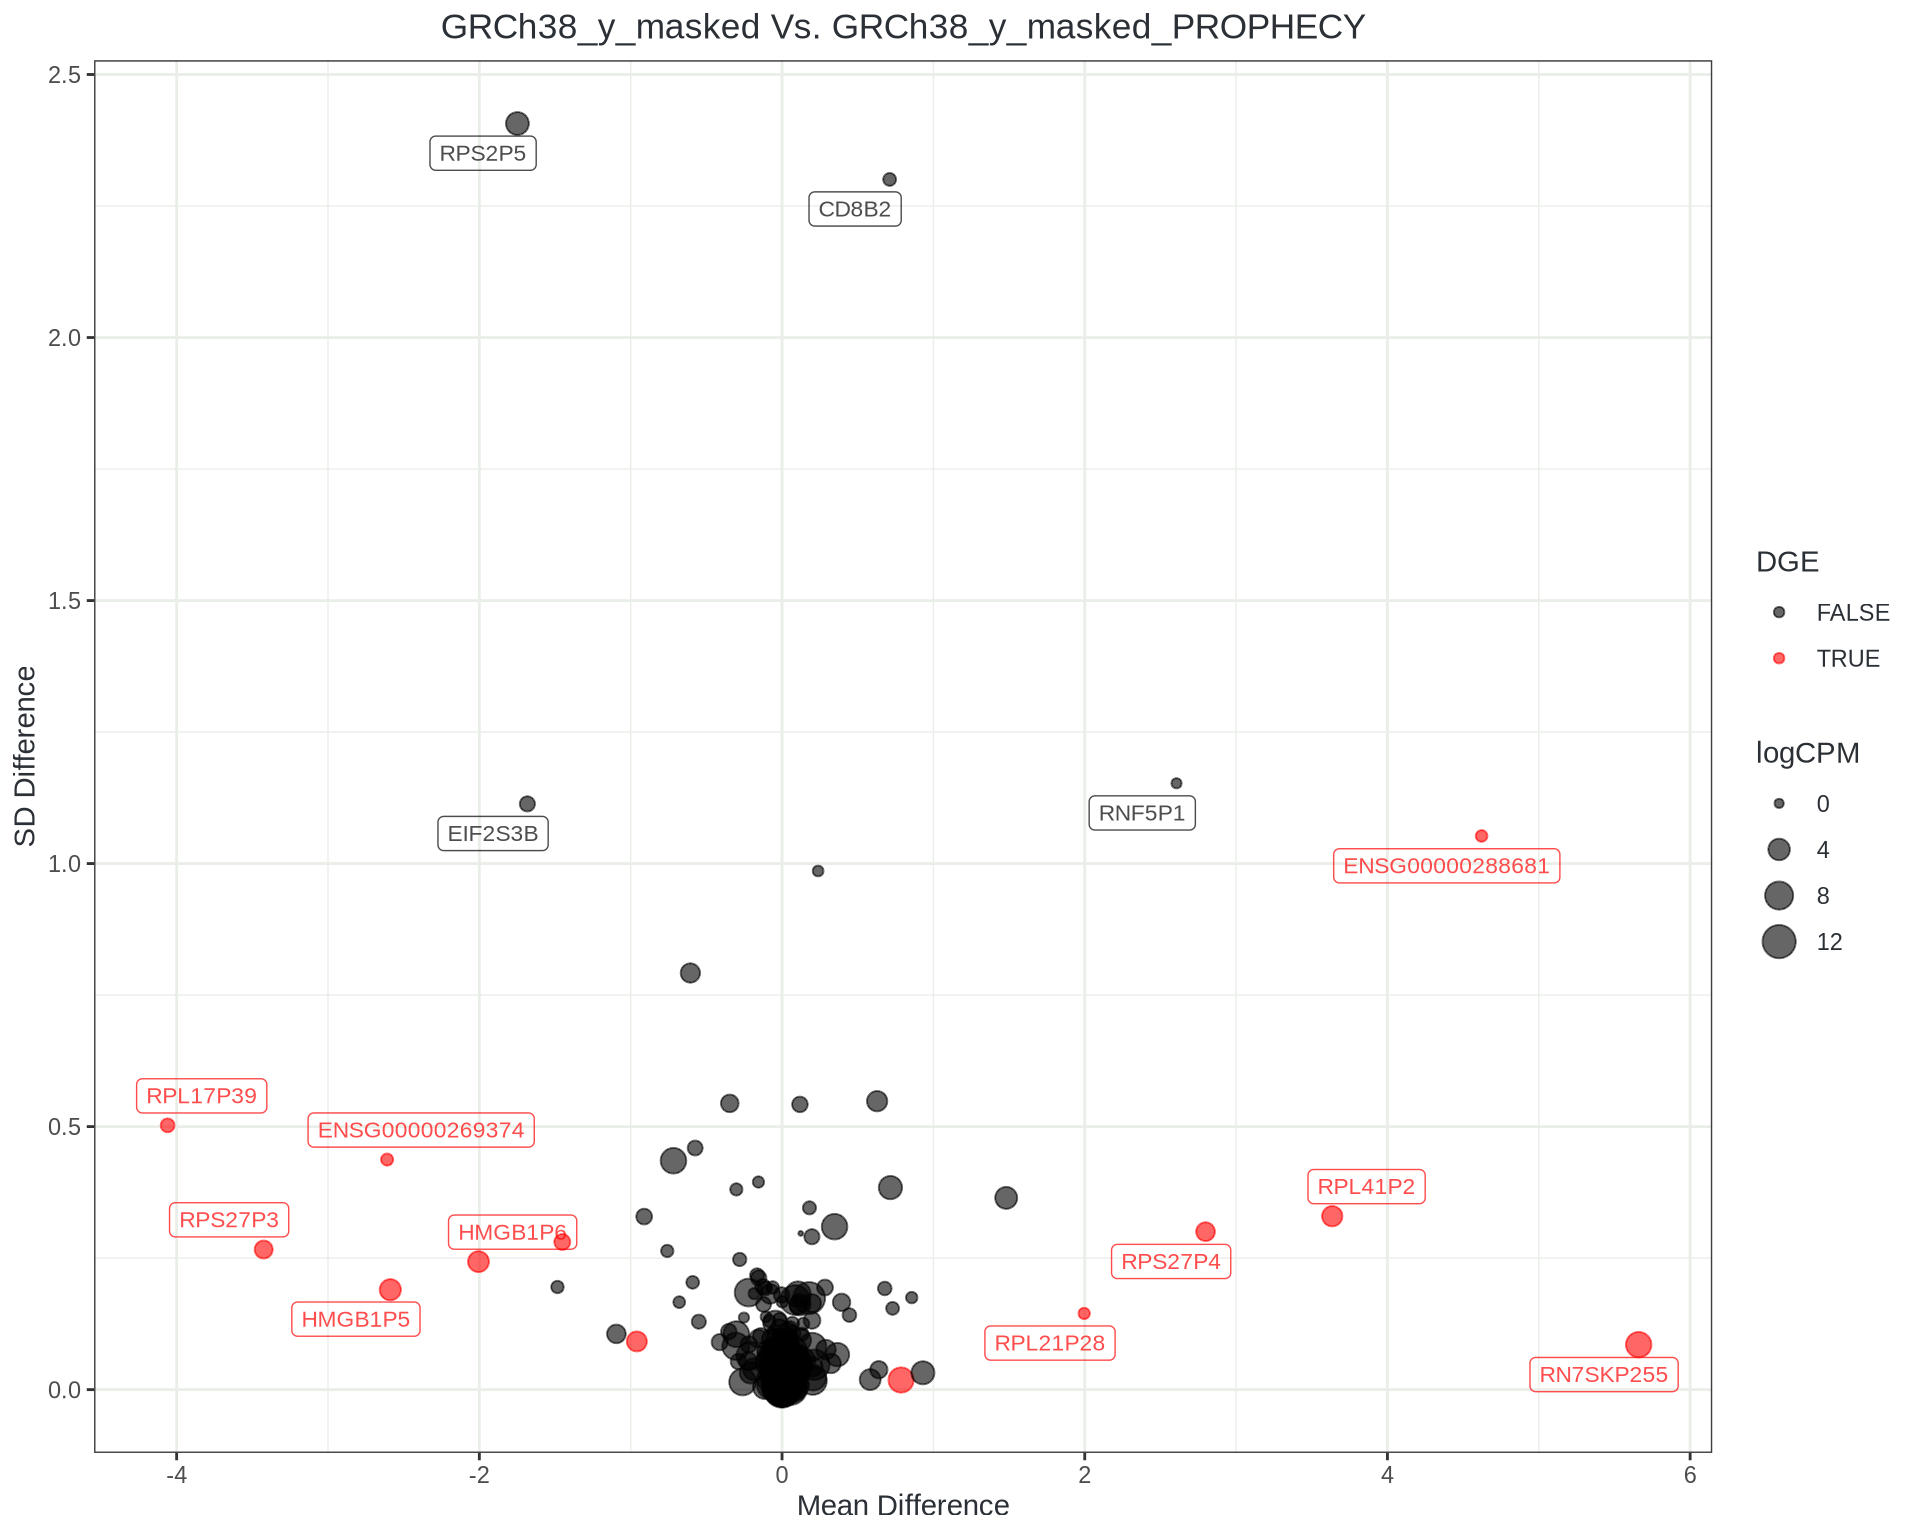
Taking expression estimates within each reference:
- Find the difference in counts per gene & sample
- Take mean & sd of differences
- Consistent changes will be low-variability, far from zero
- Inconsistent changes high-variability but near zero
- Like looking through an MA plot with variability as 3rd dimension
Overdispersion Estimates
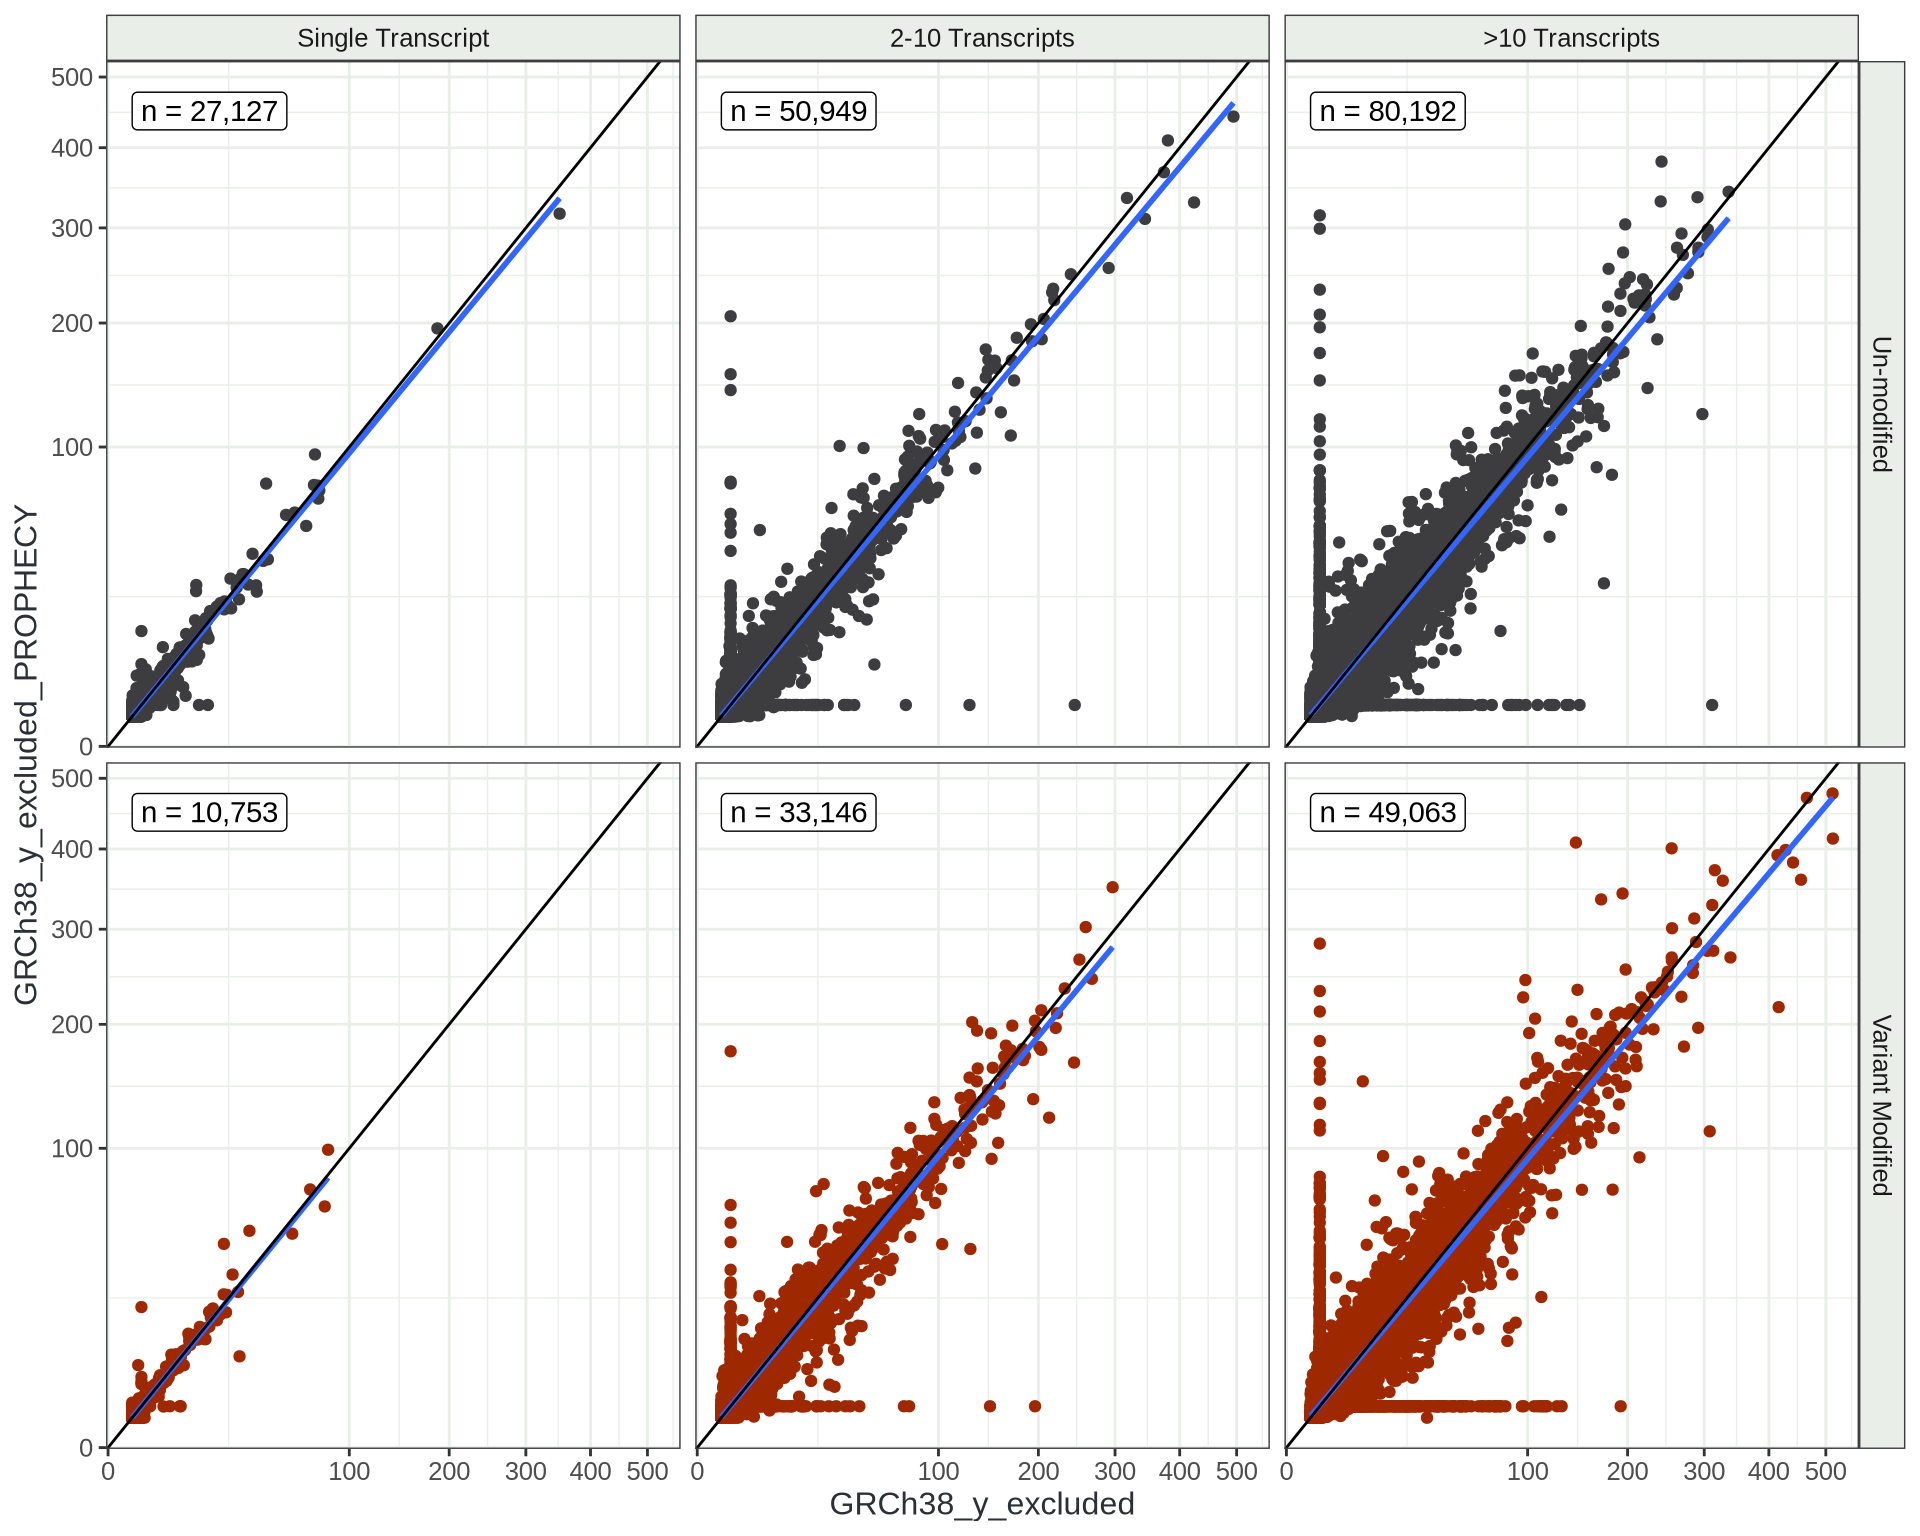
Looking at how the number of transcripts / gene also impacts these
Scaled Transcript-Level Counts
This seems quite acceptable
Variable Transcripts
Tracking Reads Which Change Transcripts
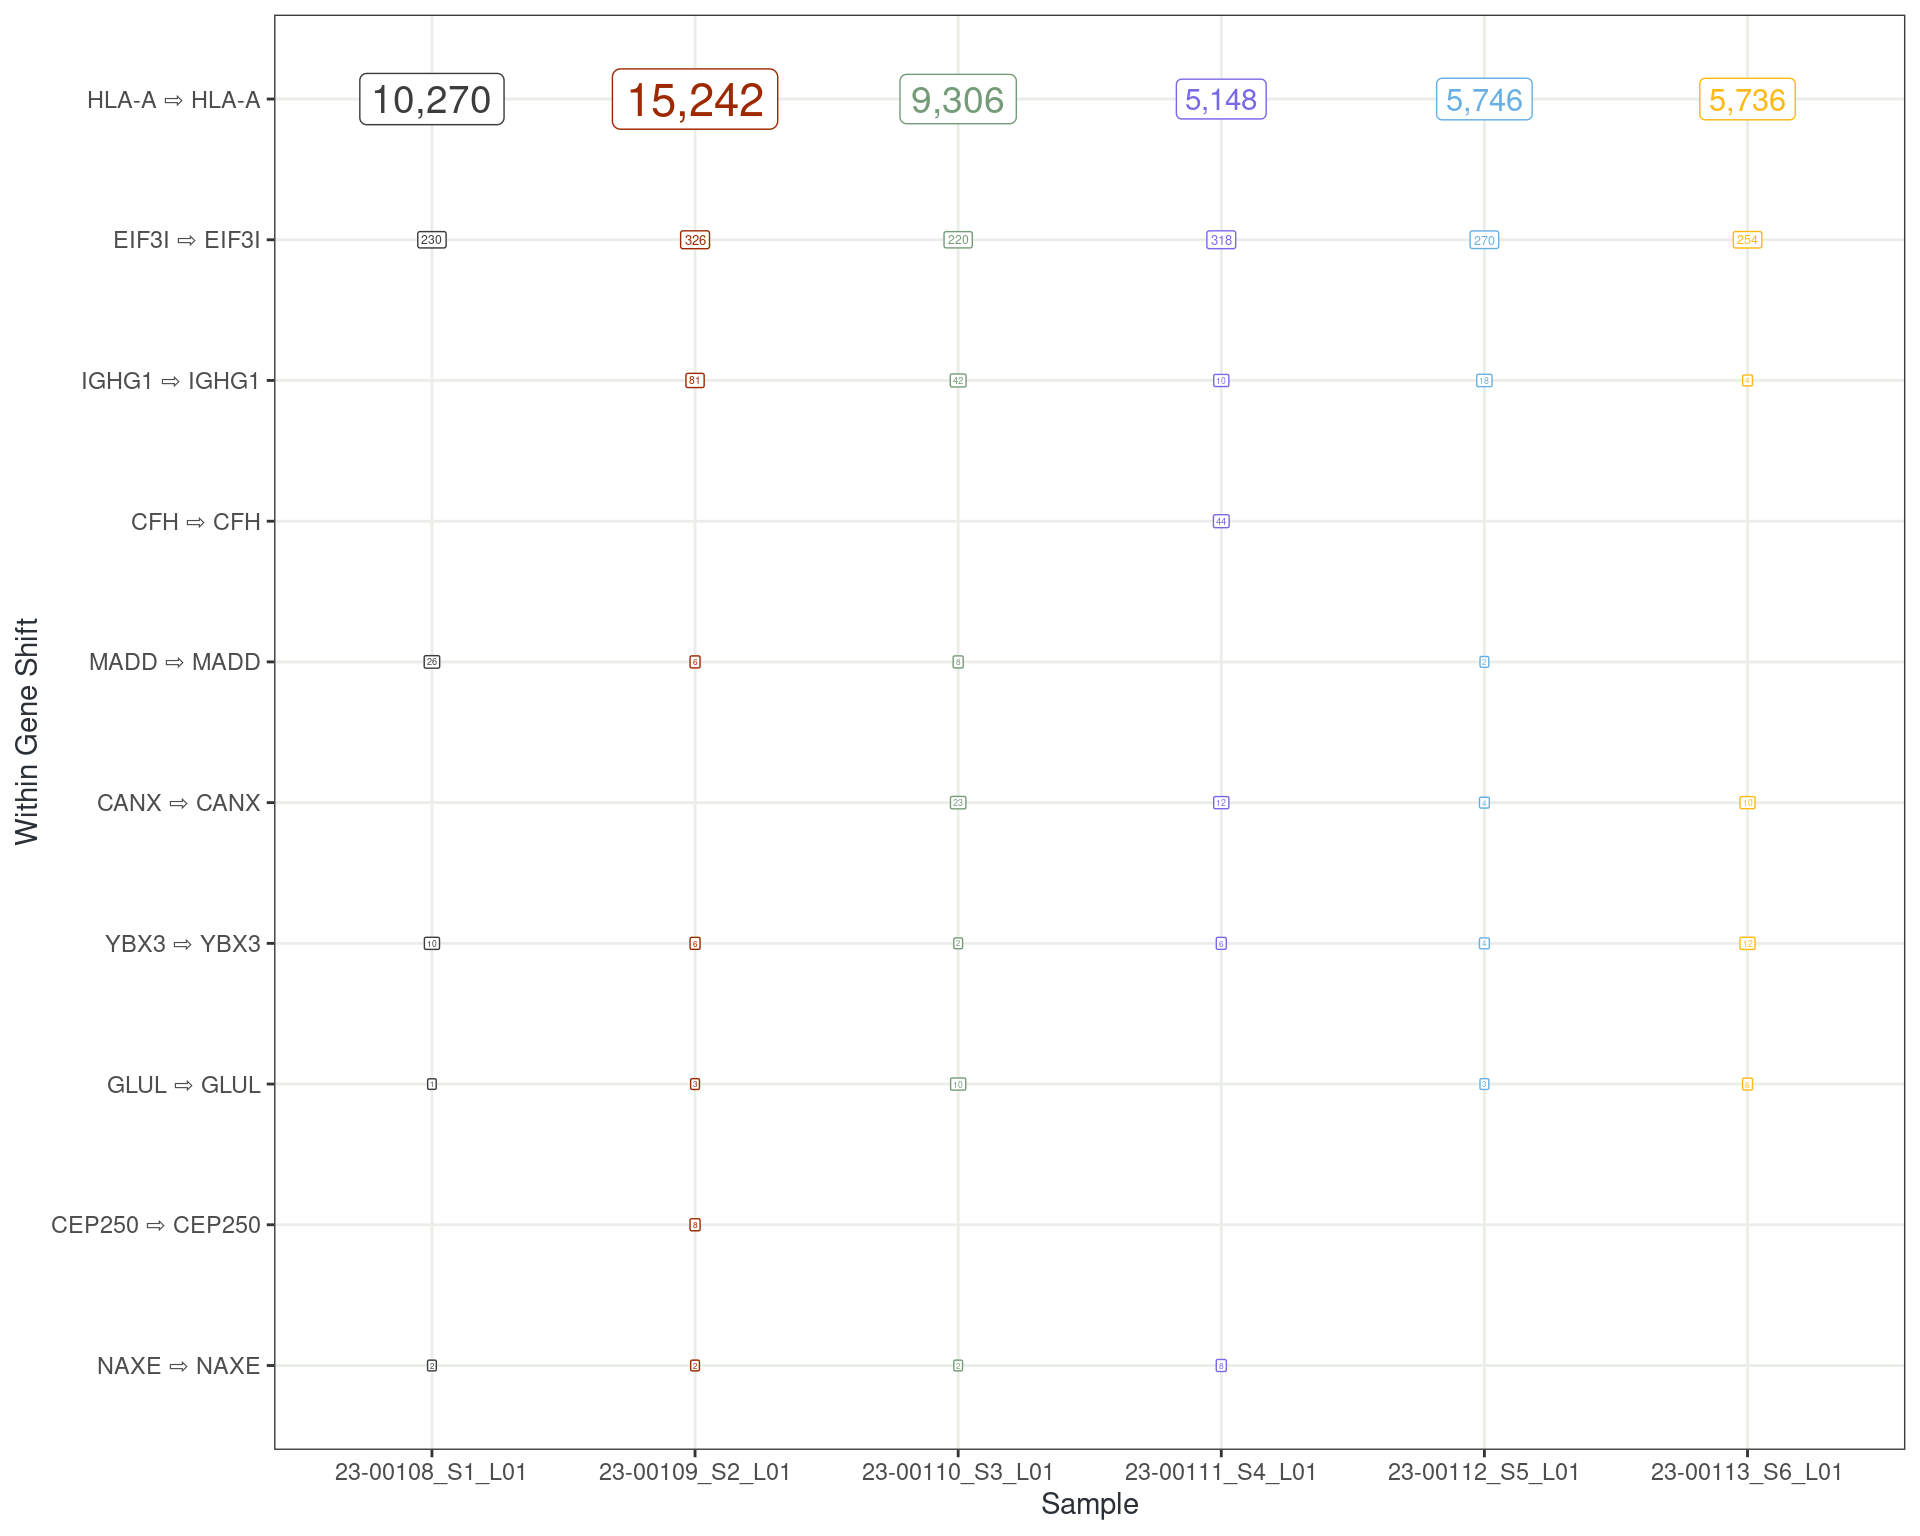
Reads changing transcript within a gene
Tracking Reads Which Change Transcripts
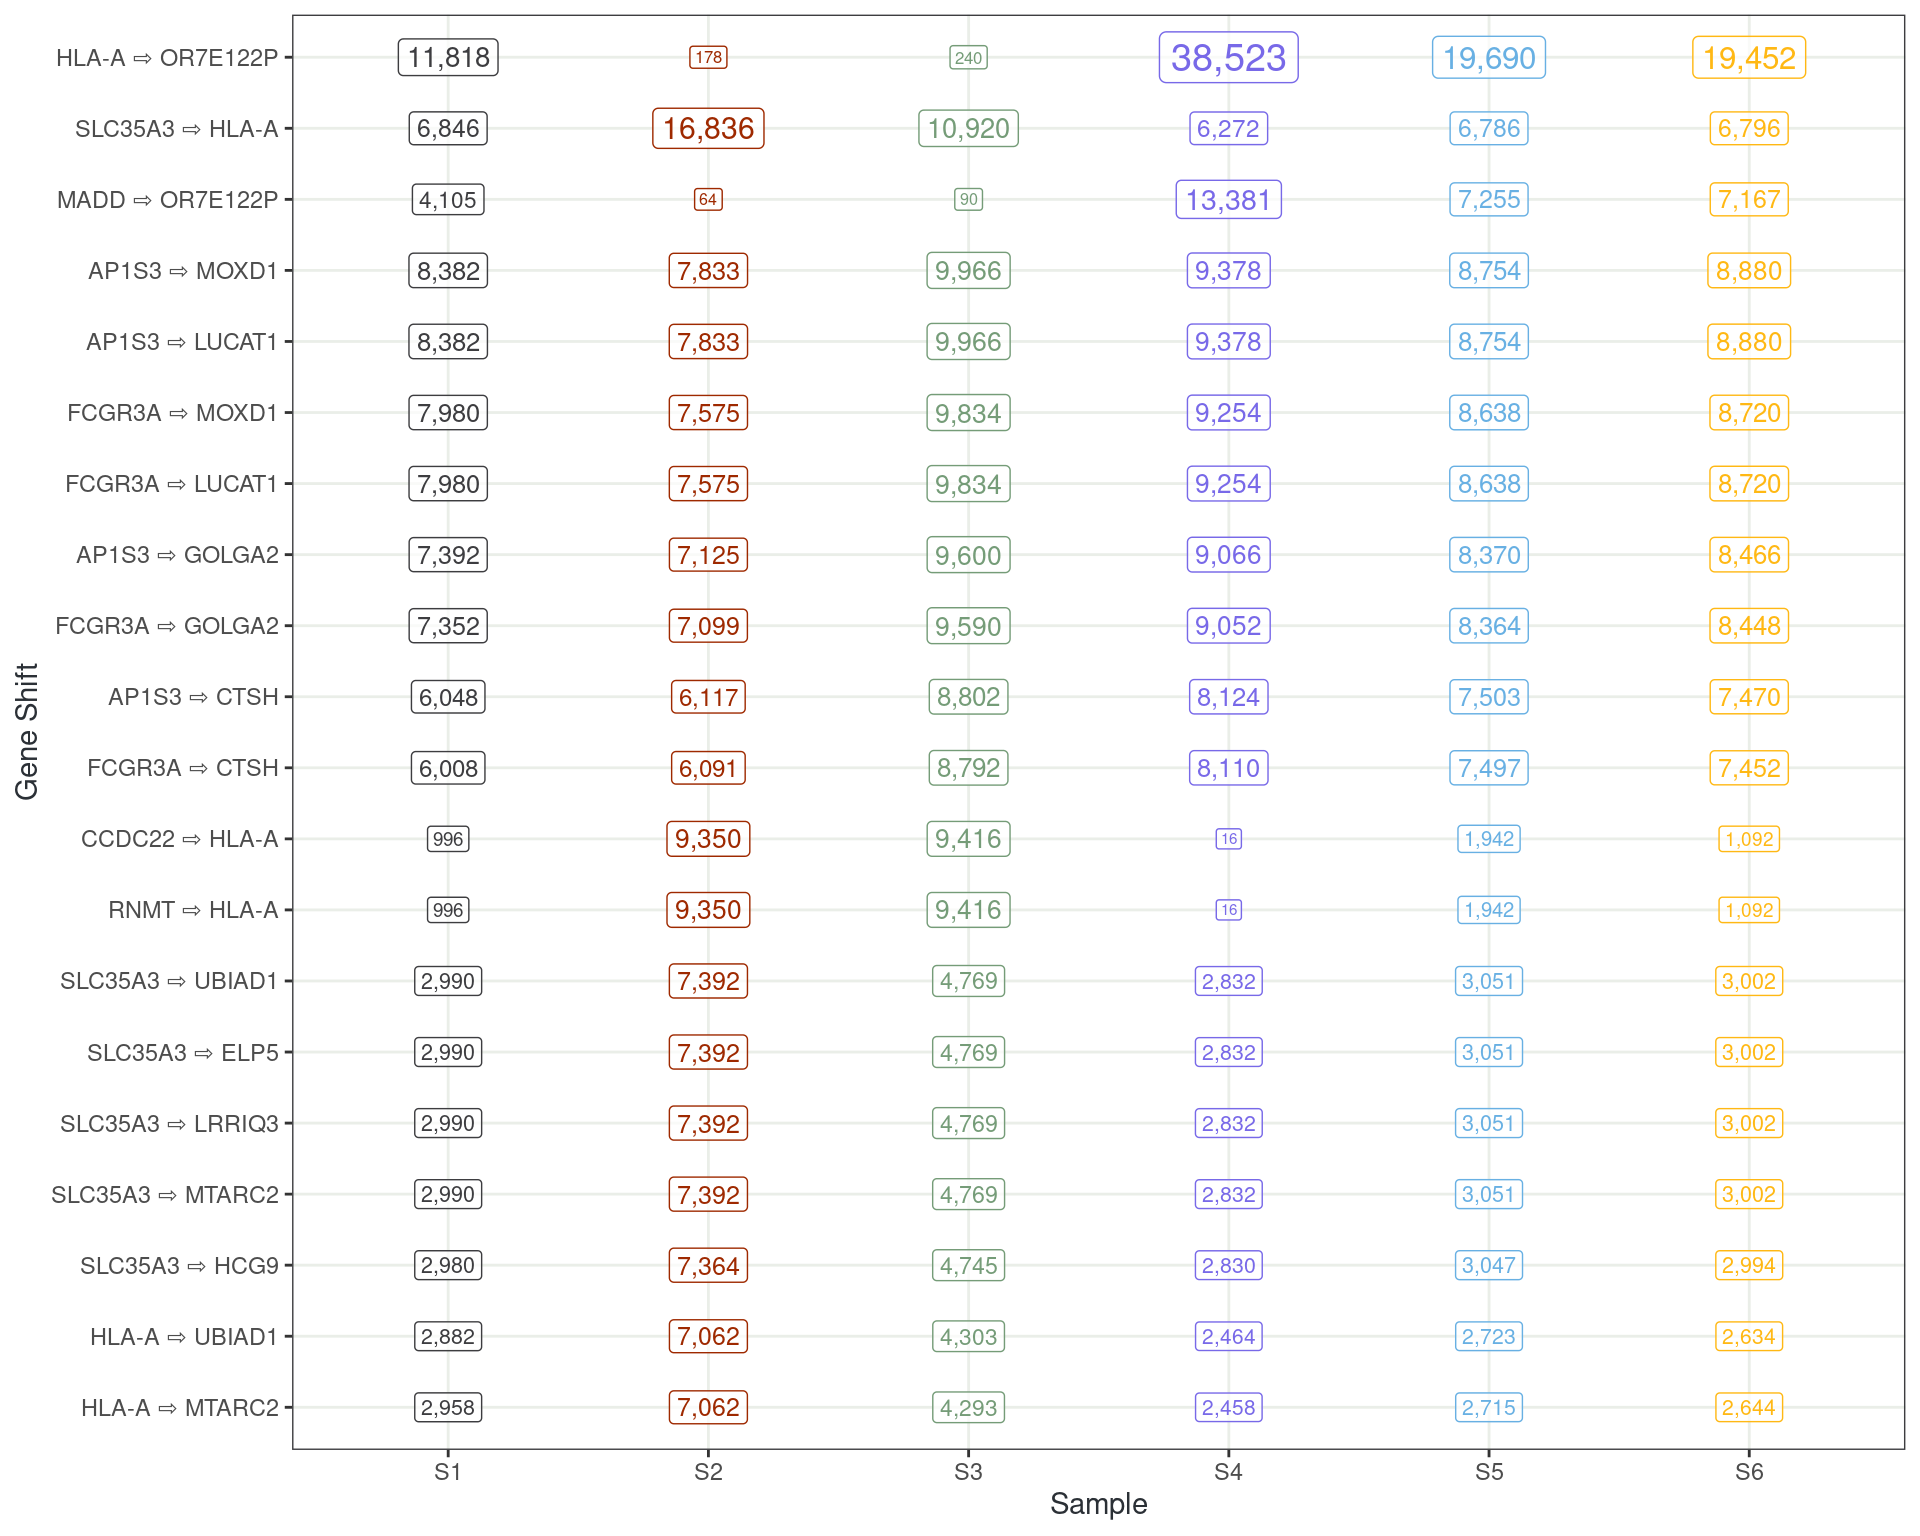
Reads changing transcript to different genes
Changing Transcripts: Gene-Level Categories
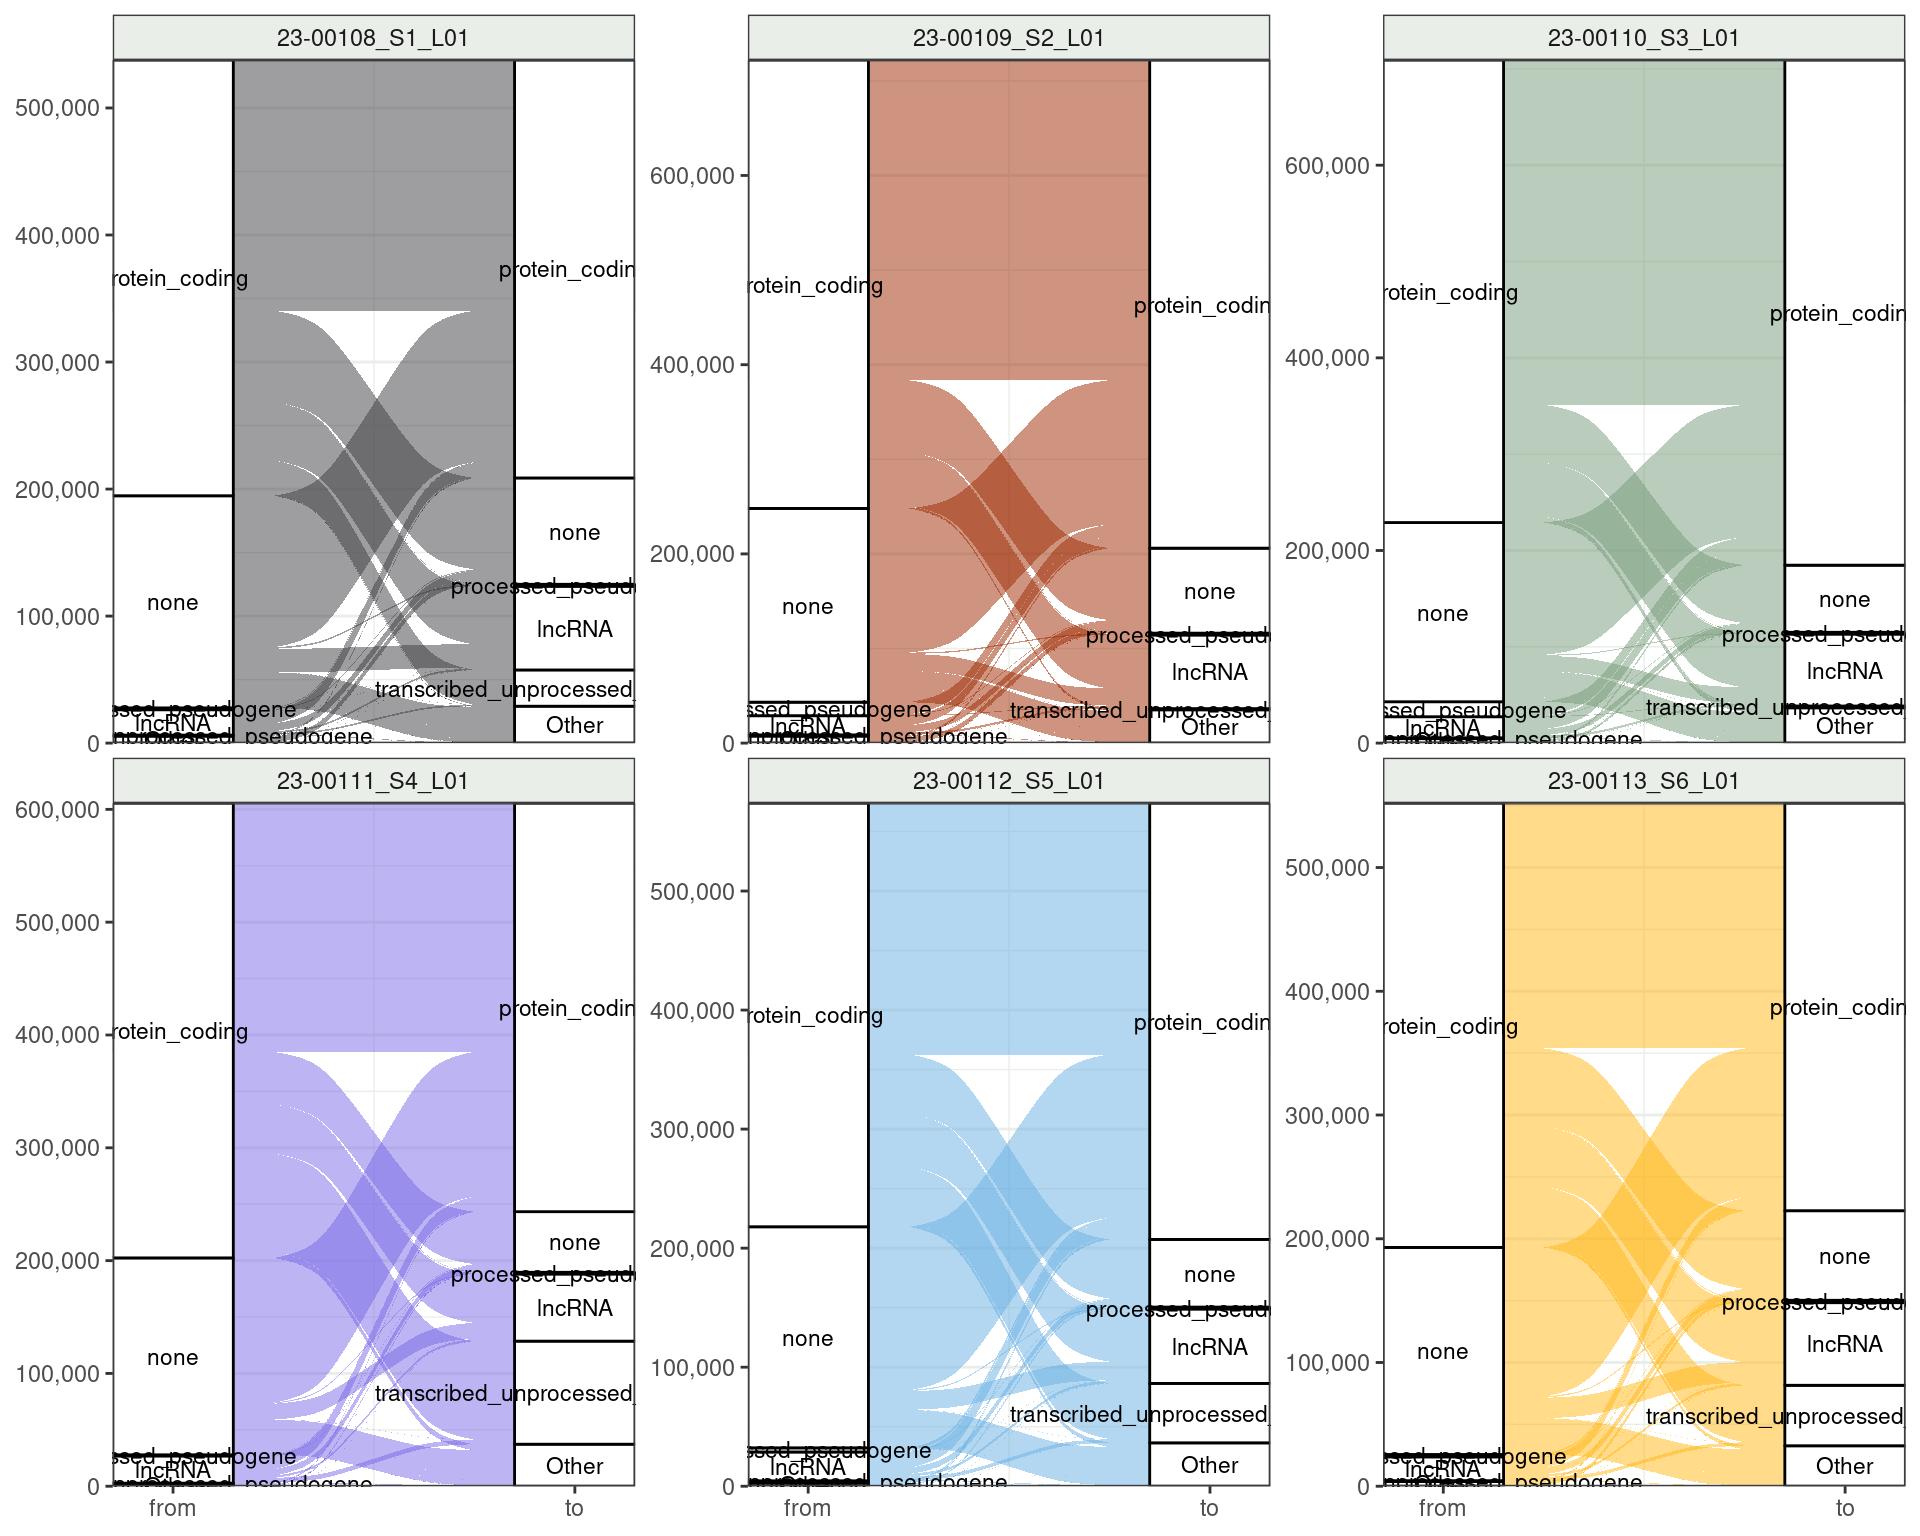
Shows a nice decrease in reads mapping nowhere
Changing Transcripts: Transcript-Level Categories
Lots of change between but no categories really sing out
Acknowledgements
Black Ochre Data Labs
Alex Brown
Jimmy Breen
Sam Buckberry
Yassine Souilmi
Bastien Llamas
Katharine Browne
Liza Kretzschmar
Alastair Ludington
Holly Massacci
Sam Godwin
Kaashifah Bruce
Rebecca Simpson
Sarah Munns
Ashlee Thomson
TKI / ALIGN
Johanna Barclay
Amanda Richards-Satour
Justine Clark
Rose Senesci
Analee Stearne
Louise Lyons
Dawn Lewis
Mary Brushe
Karrina DeMasi
Phoebe McColl
NCIG
Hardip Patel
SAHMRI
Tash Howard
Marlie Frank
SAGC
Sen Wang
Paul Wang
Renee Smith
University of Adelaide
Lachlan Baer
Monica Guilhaus
Wenjun (Nora) Liu
Megan Monaghan
![]()