ALIGN Capacity Building
The Why, What and How of Transcriptomics
November 7, 2023
DNA
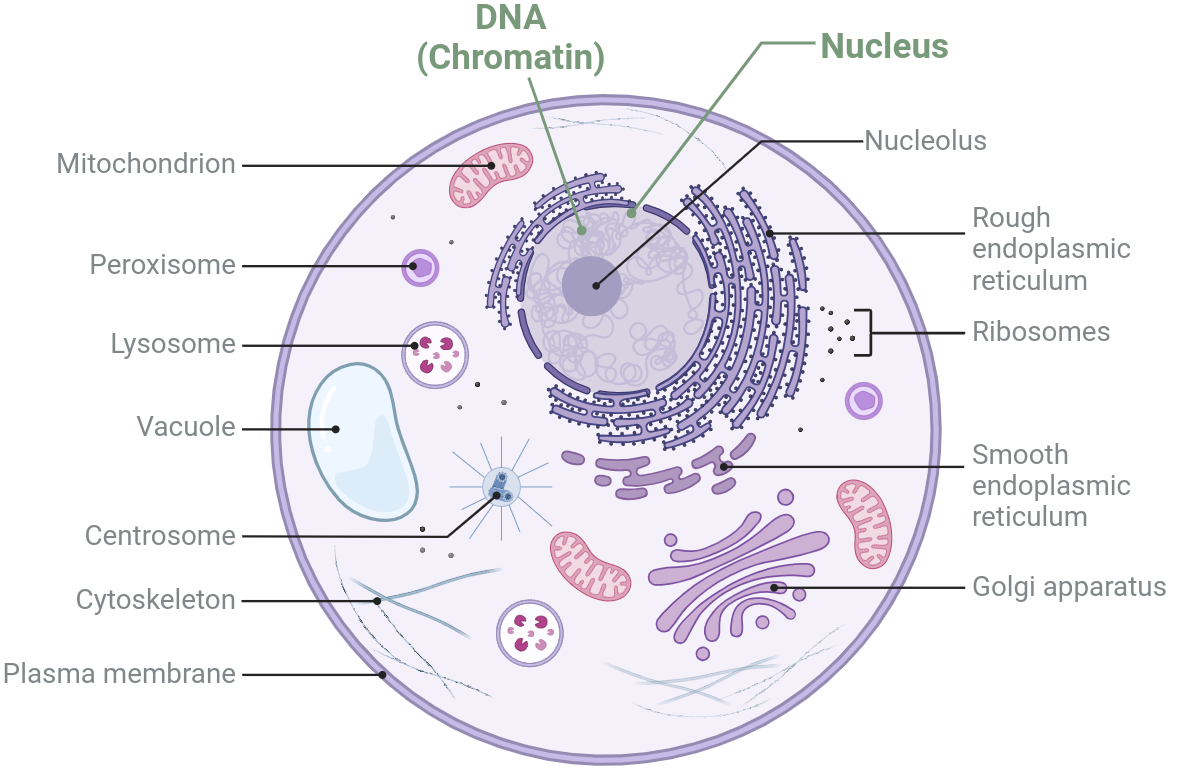
- Most are familiar with DNA and cells
- DNA stays in the nucleus
- Directly inherited from parents
\(\implies\) unique people - The same in every cell (roughly)
- Generally static (until cell division)
- Lots of interaction with other molecules: DNA-methylation, Histones etc.
DNA
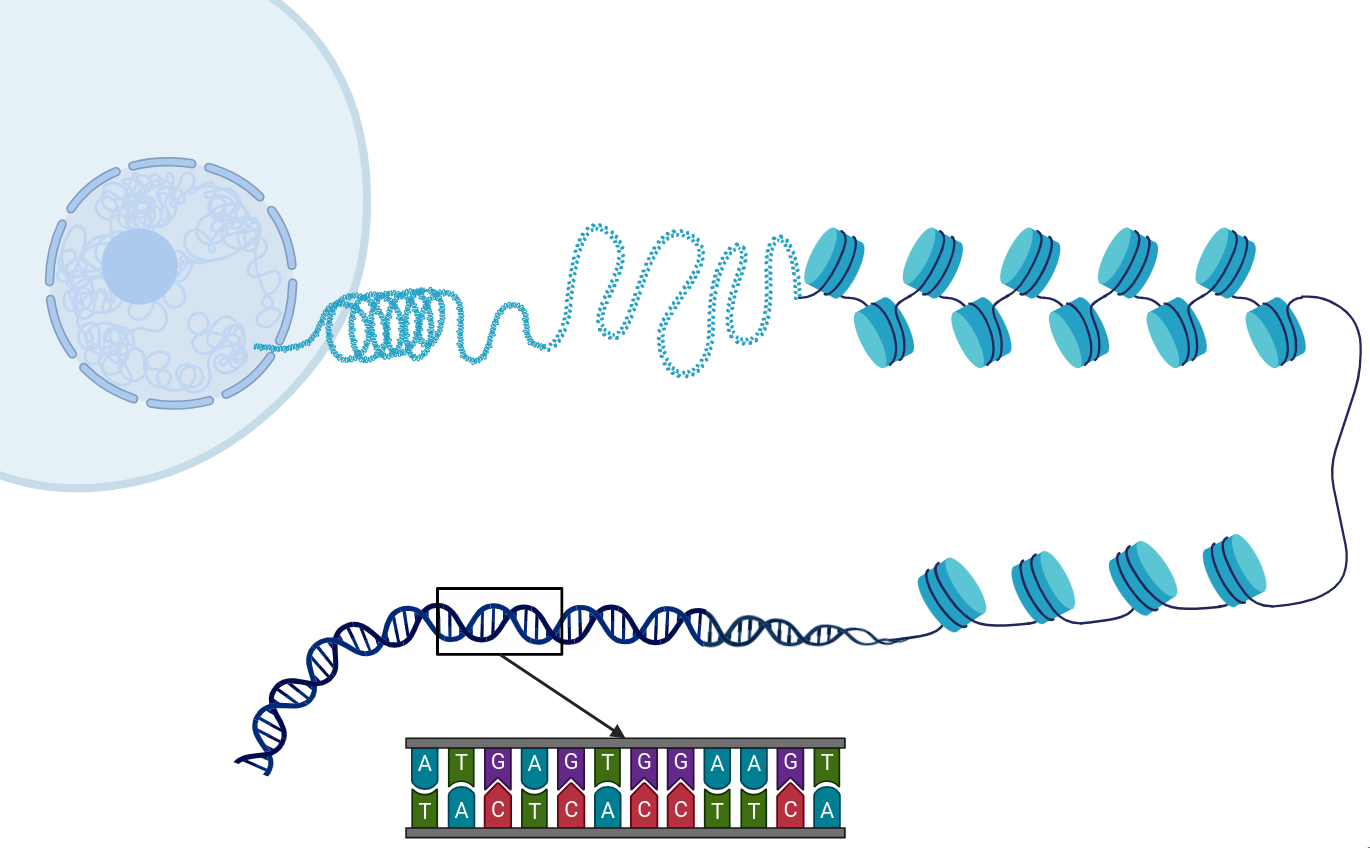
Each chromosome is a string of millions of nucleotides
- 4 nucleotides (or bases): A, C, G, T
- Double-stranded molecule, i.e. double helix
- Adds incredible stability
- Provides error handling mechanism
- Amazing amount of 3D structure & packaging
- Only forms the classic
![]() shape during cell division
shape during cell division
 shape during cell division
Transcriptomics
Our classic viewpoint is DNA \(\implies\) mRNA \(\implies\) Protein
Many other types of RNA play key roles
- miRNA bind to and degrade target mRNA
- lncRNA form highly complex structures
\(\implies\)can silence chromosomal regions (e.g. XIST)1
- rRNA are key components of ribosomes
- tRNA interact with ribosomes
\(\implies\) translate mRNA into proteins2

What is an RNA transcript?
- Known transcribed regions are defined as genes
- Transcribed from DNA \(\implies\) start to finish
- From the complete RNA transcript:
- Exons form mature transcript
- Introns are spliced out
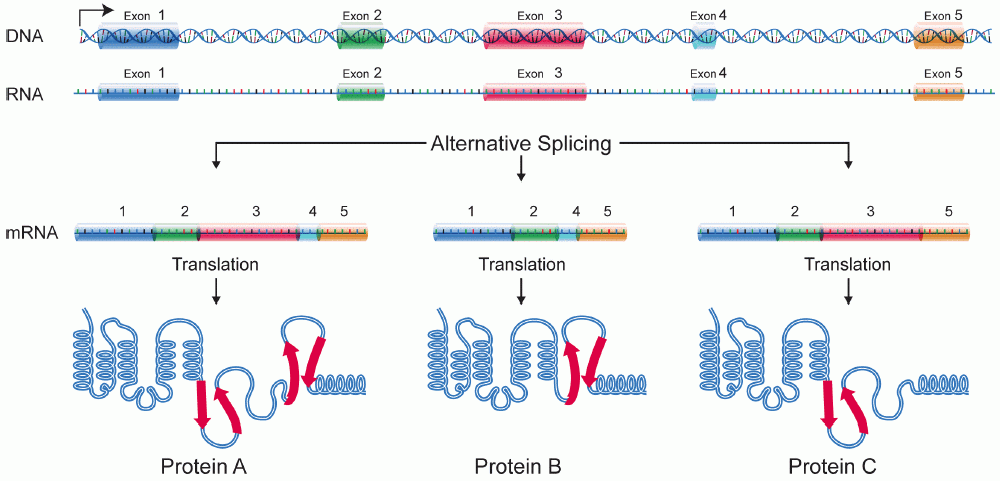
- ~38% of genes (~24,000) are transcribed into multiple transcripts
- Different transcripts \(\implies\) Different proteins (or lncRNA etc.)
Early Gene Expression Approaches
- The first high-throughput platform was Microarrays
- 3’ Arrays (Affymetrix)
- Gene-centric approach
- Could analyse 10-15,000 genes
- Abundance only analysis
- Many statistical tools developed in this context
limmahas been maintained by Gordon Smyth (WEHI) for >20years
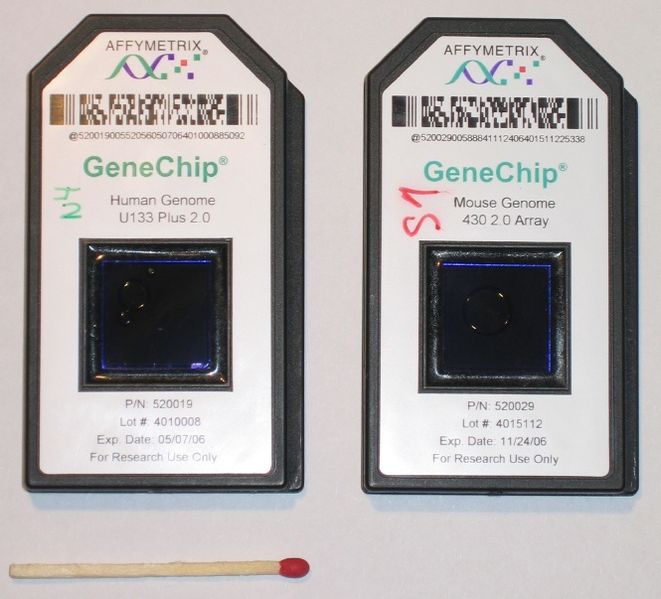
Microarrays
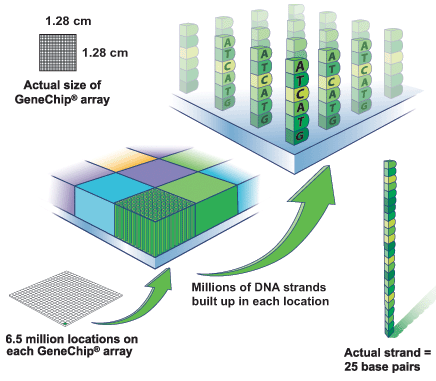
Known sequences at known locations

Labelled cDNA binds complementary target
- We analysed fluorescence NOT sequence data
Bulk RNA Sequencing
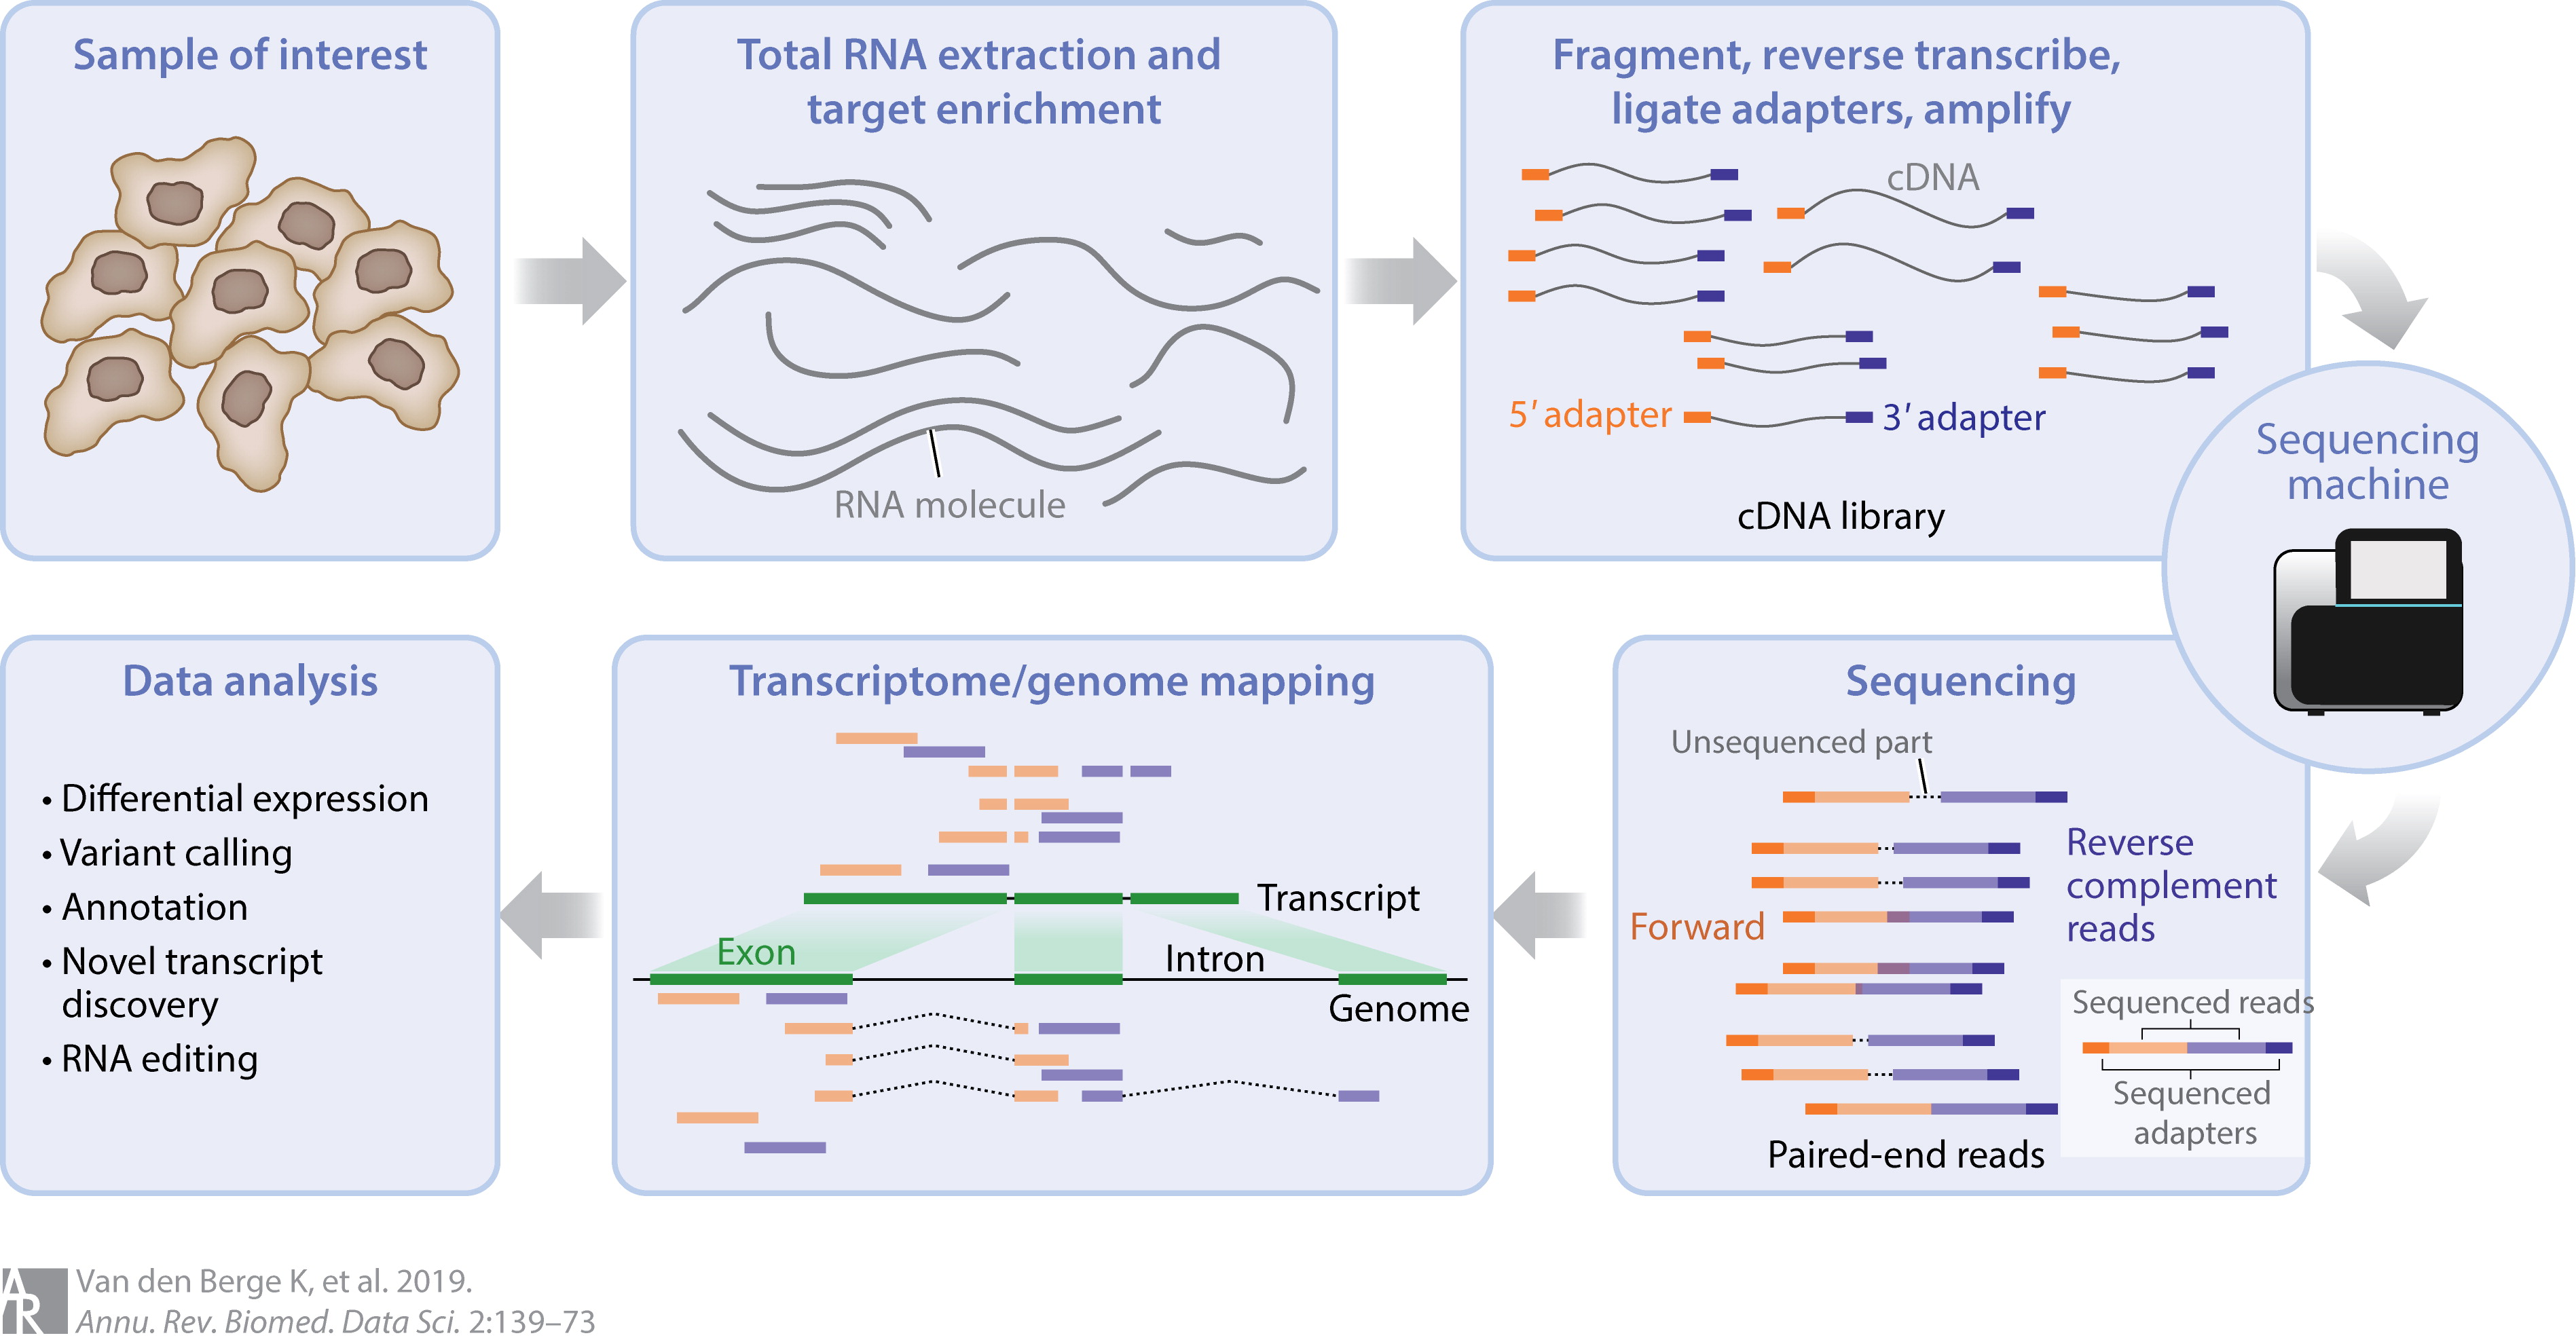
Two Approaches To Alignment
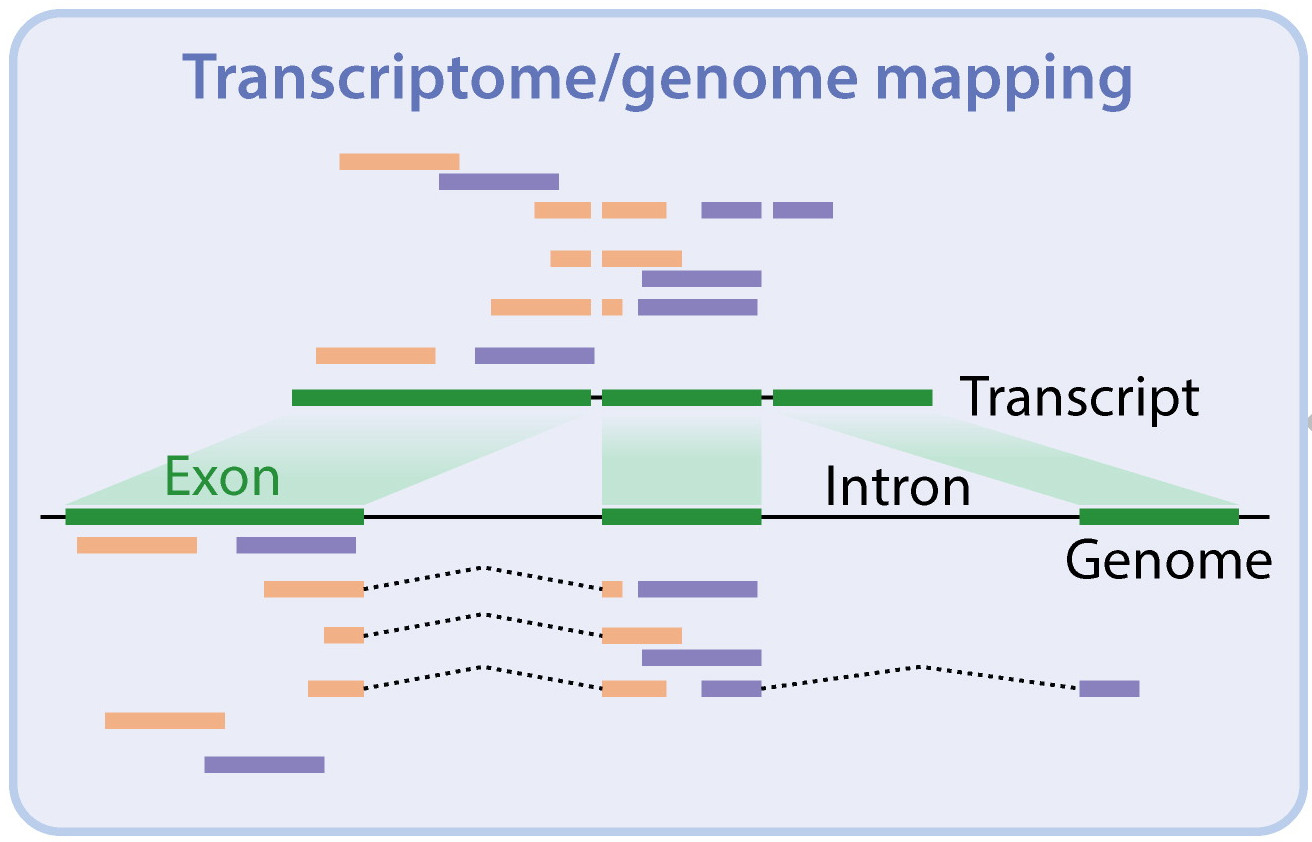
- Alignment to a reference genome
- Most align to one location \(\implies\) can see where ✓
- Brilliant for gene-level counts ✓
- Can call variants (allelic bias) ✓
- Not helpful for transcript-level ✗
- Alignment to a reference transcriptome
- Obtain transcript & gene-level counts ✓
- Many exons shared with multiple transcripts
\(\implies\) can model uncertainty ✓ - Don’t know where each read has aligned ✗
- No variant calling
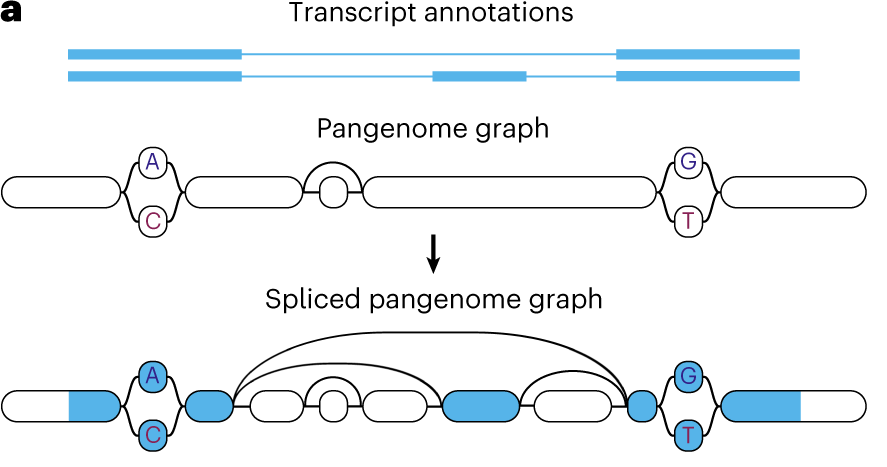
Graph Based Approaches
- Telomere-to-telomere (T2T) assemblies contain no scaffolds
- Just chr1-22, X, Y & MT
- Individual assemblies \(\implies\) haplotype resolved
- Separate out both copies of chr1 etc.
- Can construct a reference graph
- Shared sequences between chromosome pairs are joined
- Variation represented as bubbles
- For >1 individual would be a pangenome graph
Differential Gene Expression


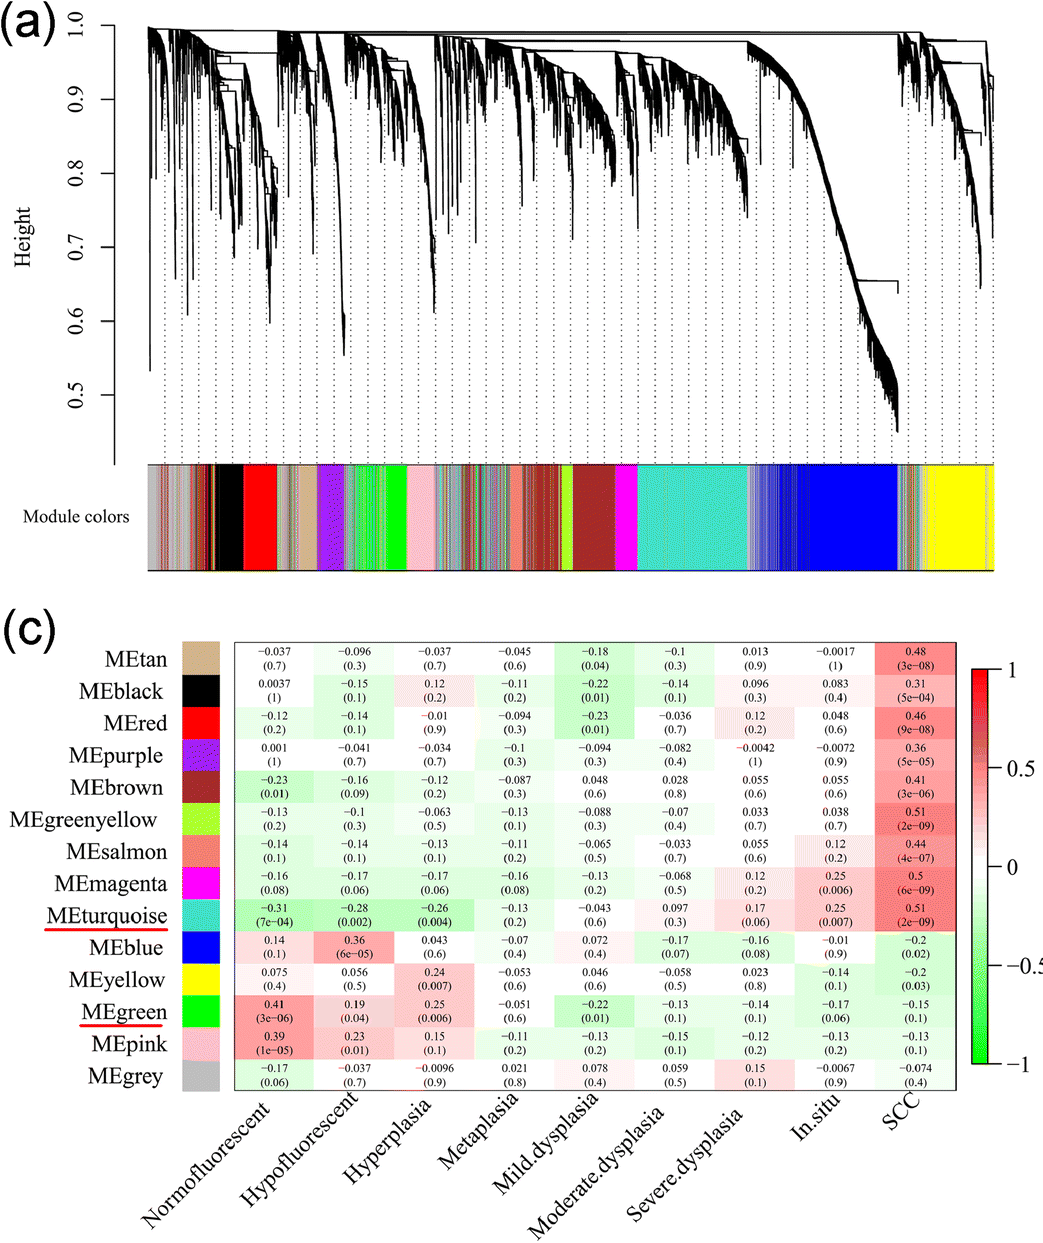
WGCNA
- Multiple approaches with WGCNA the biggest player
- Form correlation network
- Identify modules within correlation network
- Compare to predictor variables
- Identify underlying biology
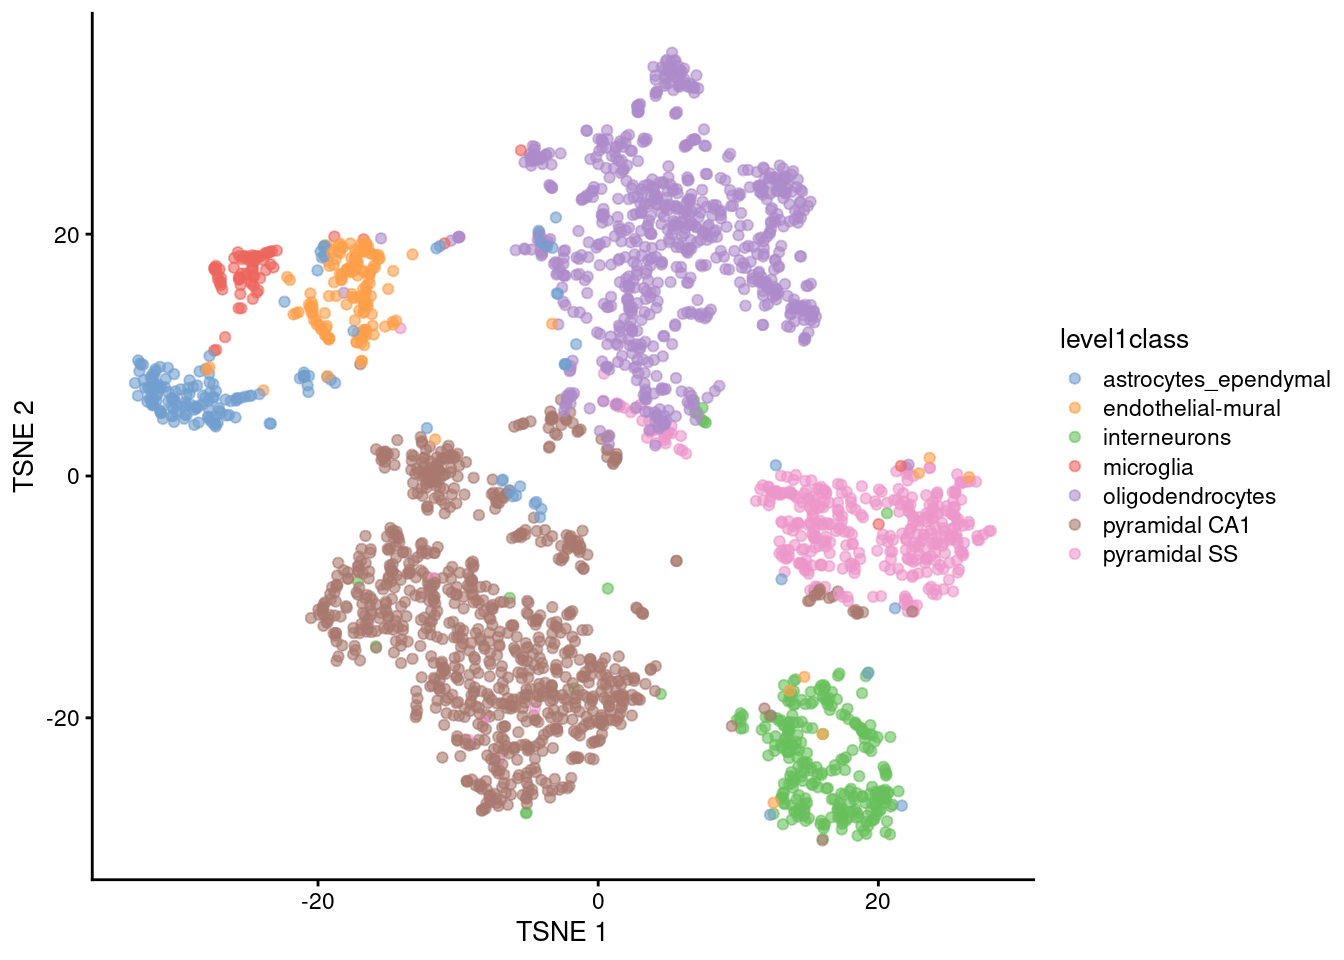
scRNA-Seq
- Retains the connection between transcript and cell-of-origin
- Huge numbers of ‘failure to detect’ expression (i.e. zero counts)
- Uses clustering to identify cell types within a sample
- Pseudo-bulk clusters for DGE analysis
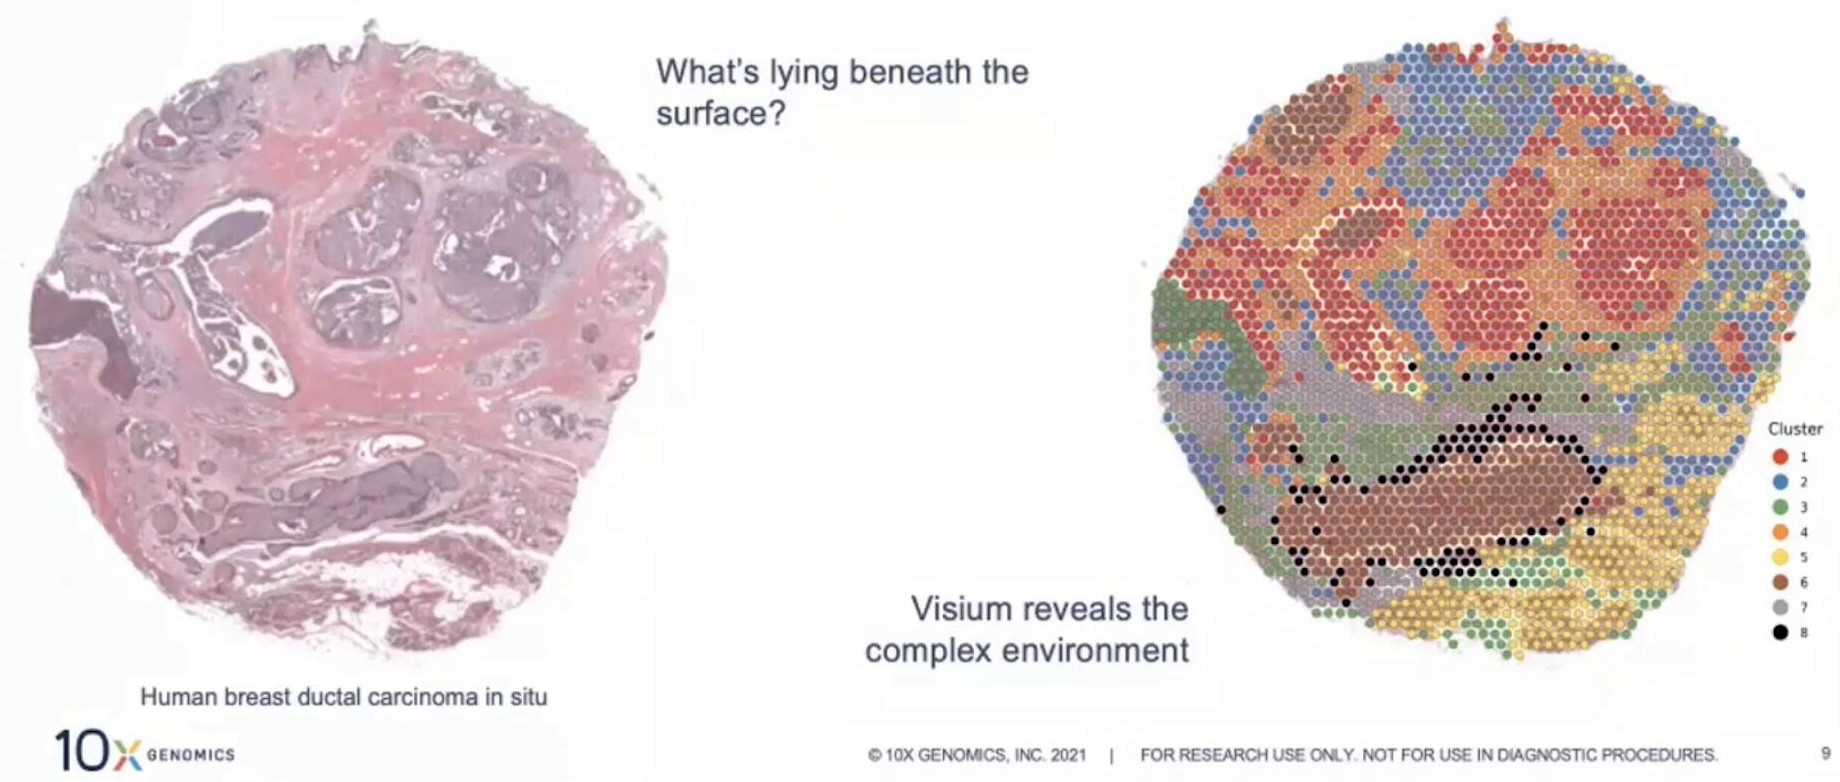
Spatial Transcriptomics
- Cells are held in place \(\implies\) transcripts identified within a region
- The current hot area in transcriptomics \(\implies\) Nature Methods “Method of the Year, 2020”
- Single-cell resolution is arguably here
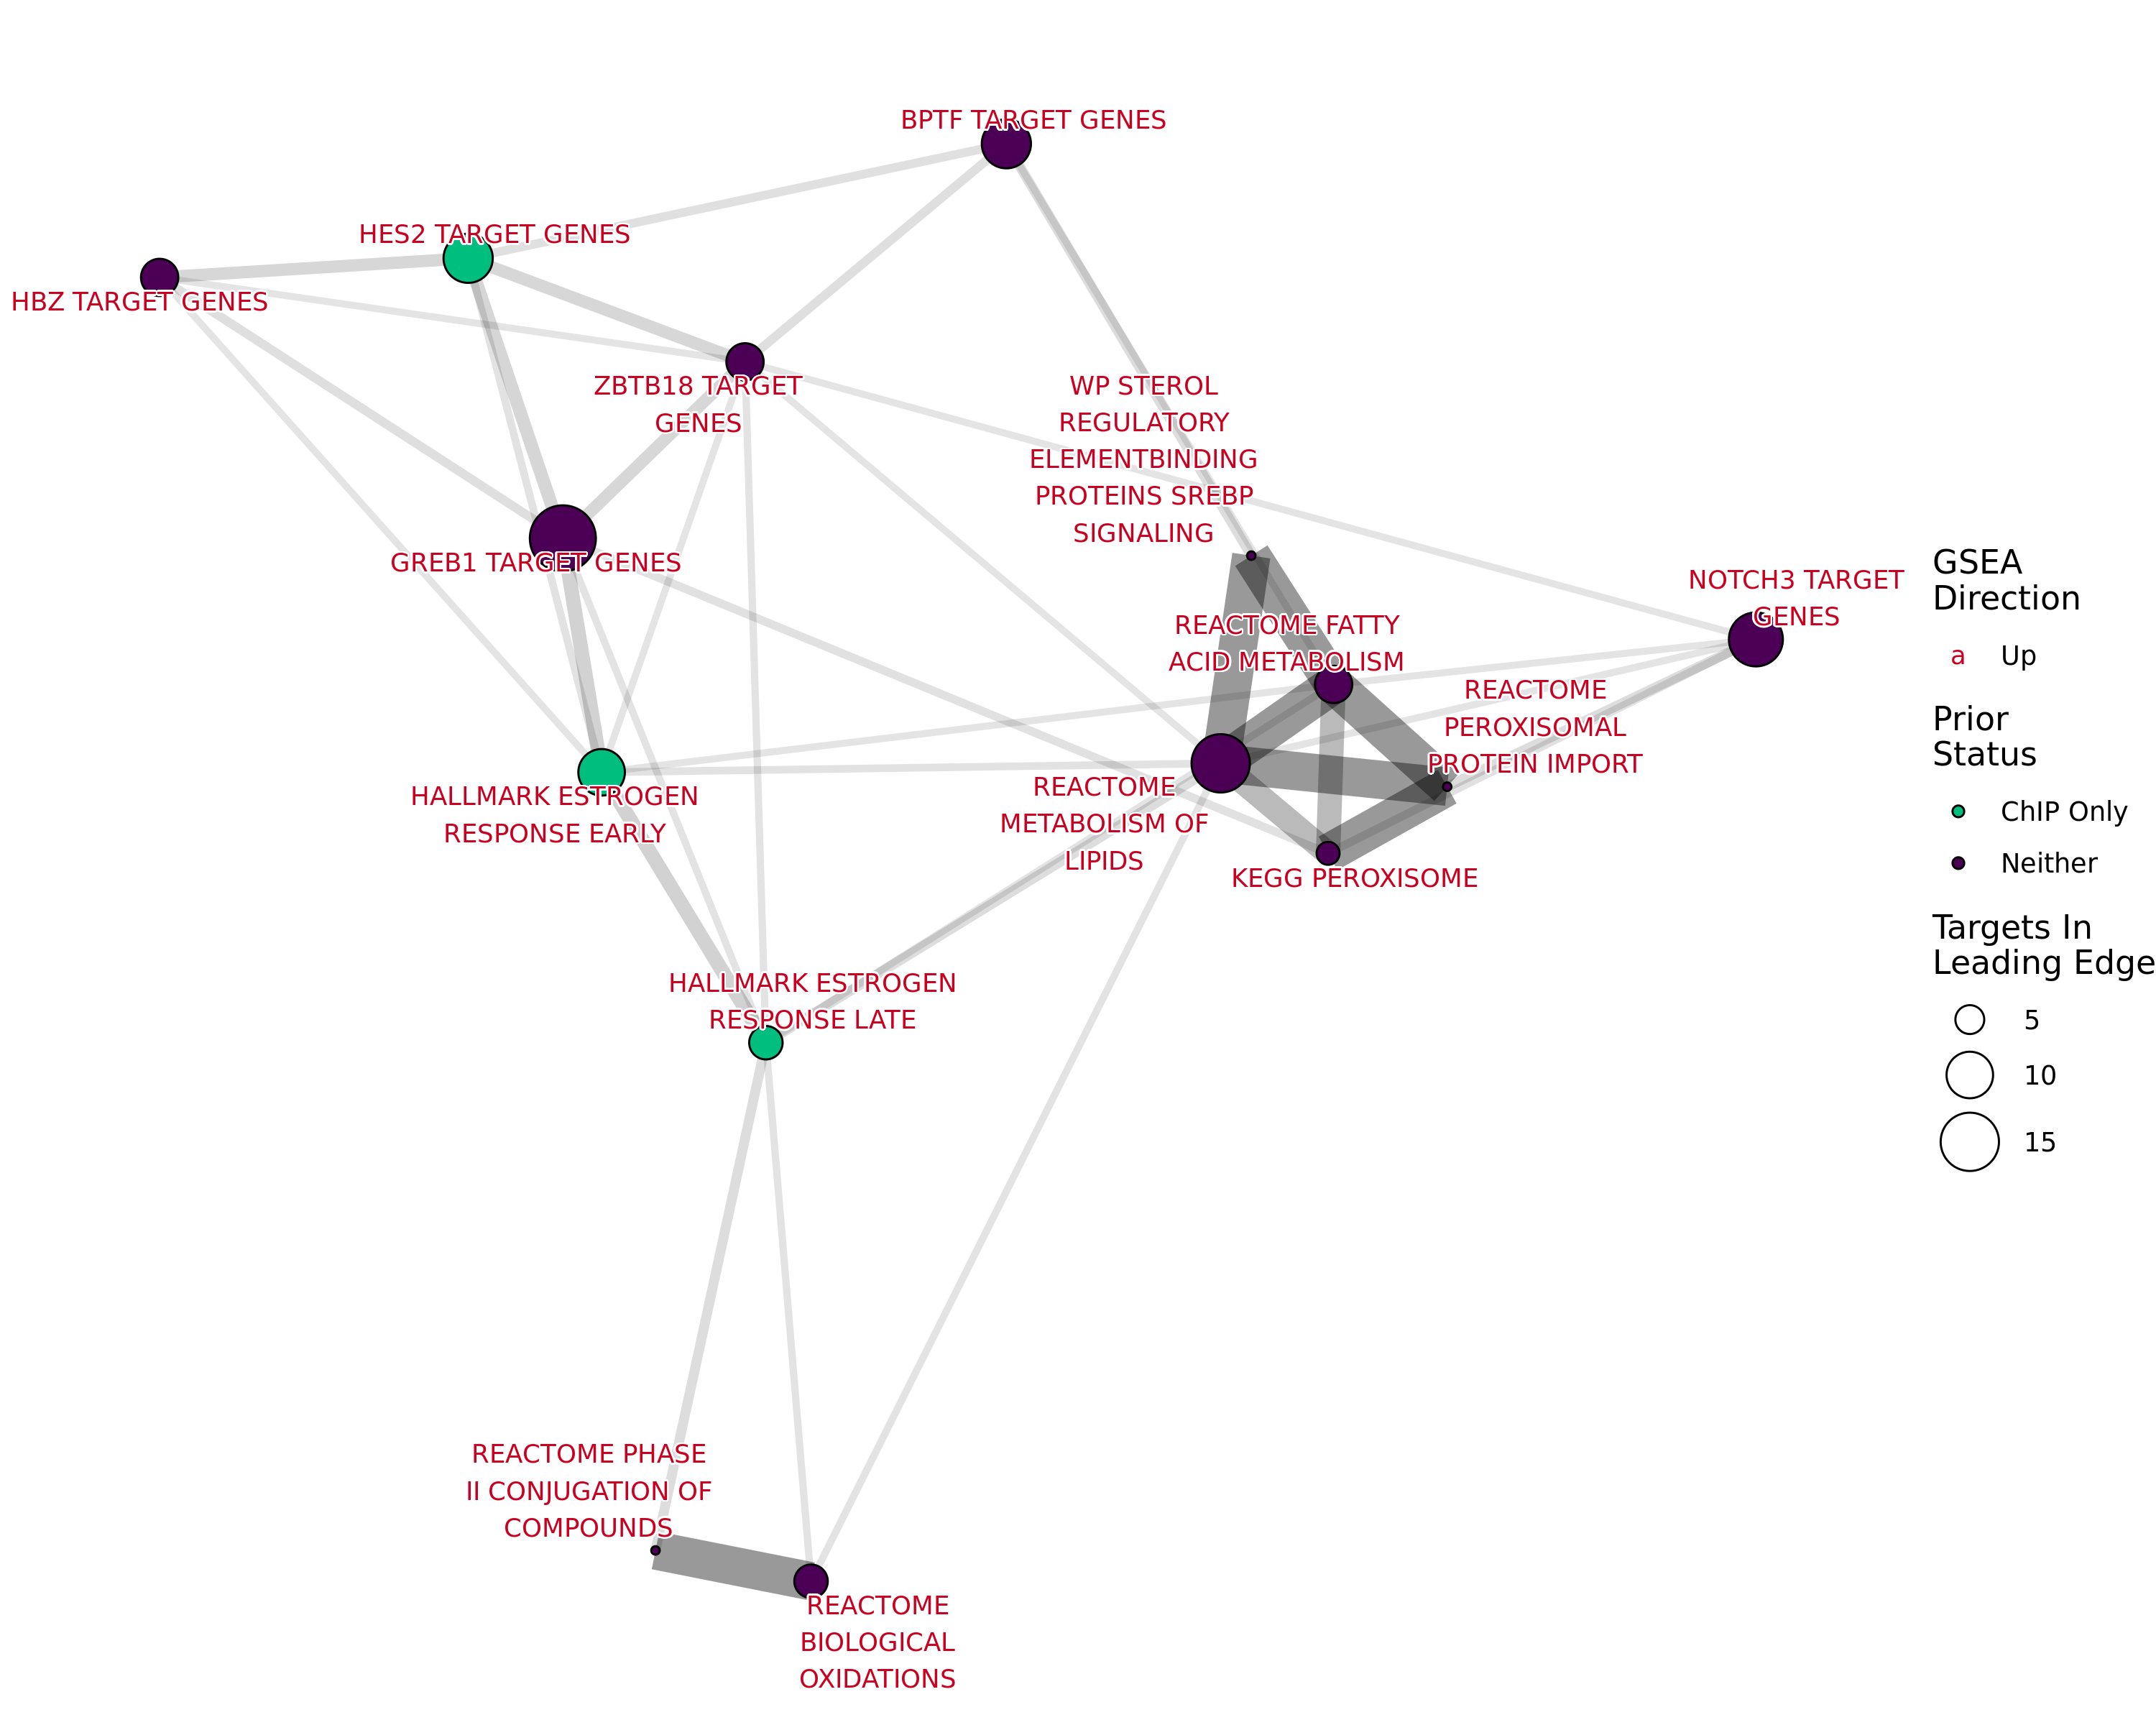
Pathway & Functional Analysis
- Look for biologically relevant signals in DE genes or network modules
- Enriched pathways
- Common transcription factors
- Drug target signals
- Compare to public datasets
(if appropriate)
- Interpretation is key
- Researchers love to invent stories
The Central Dogma
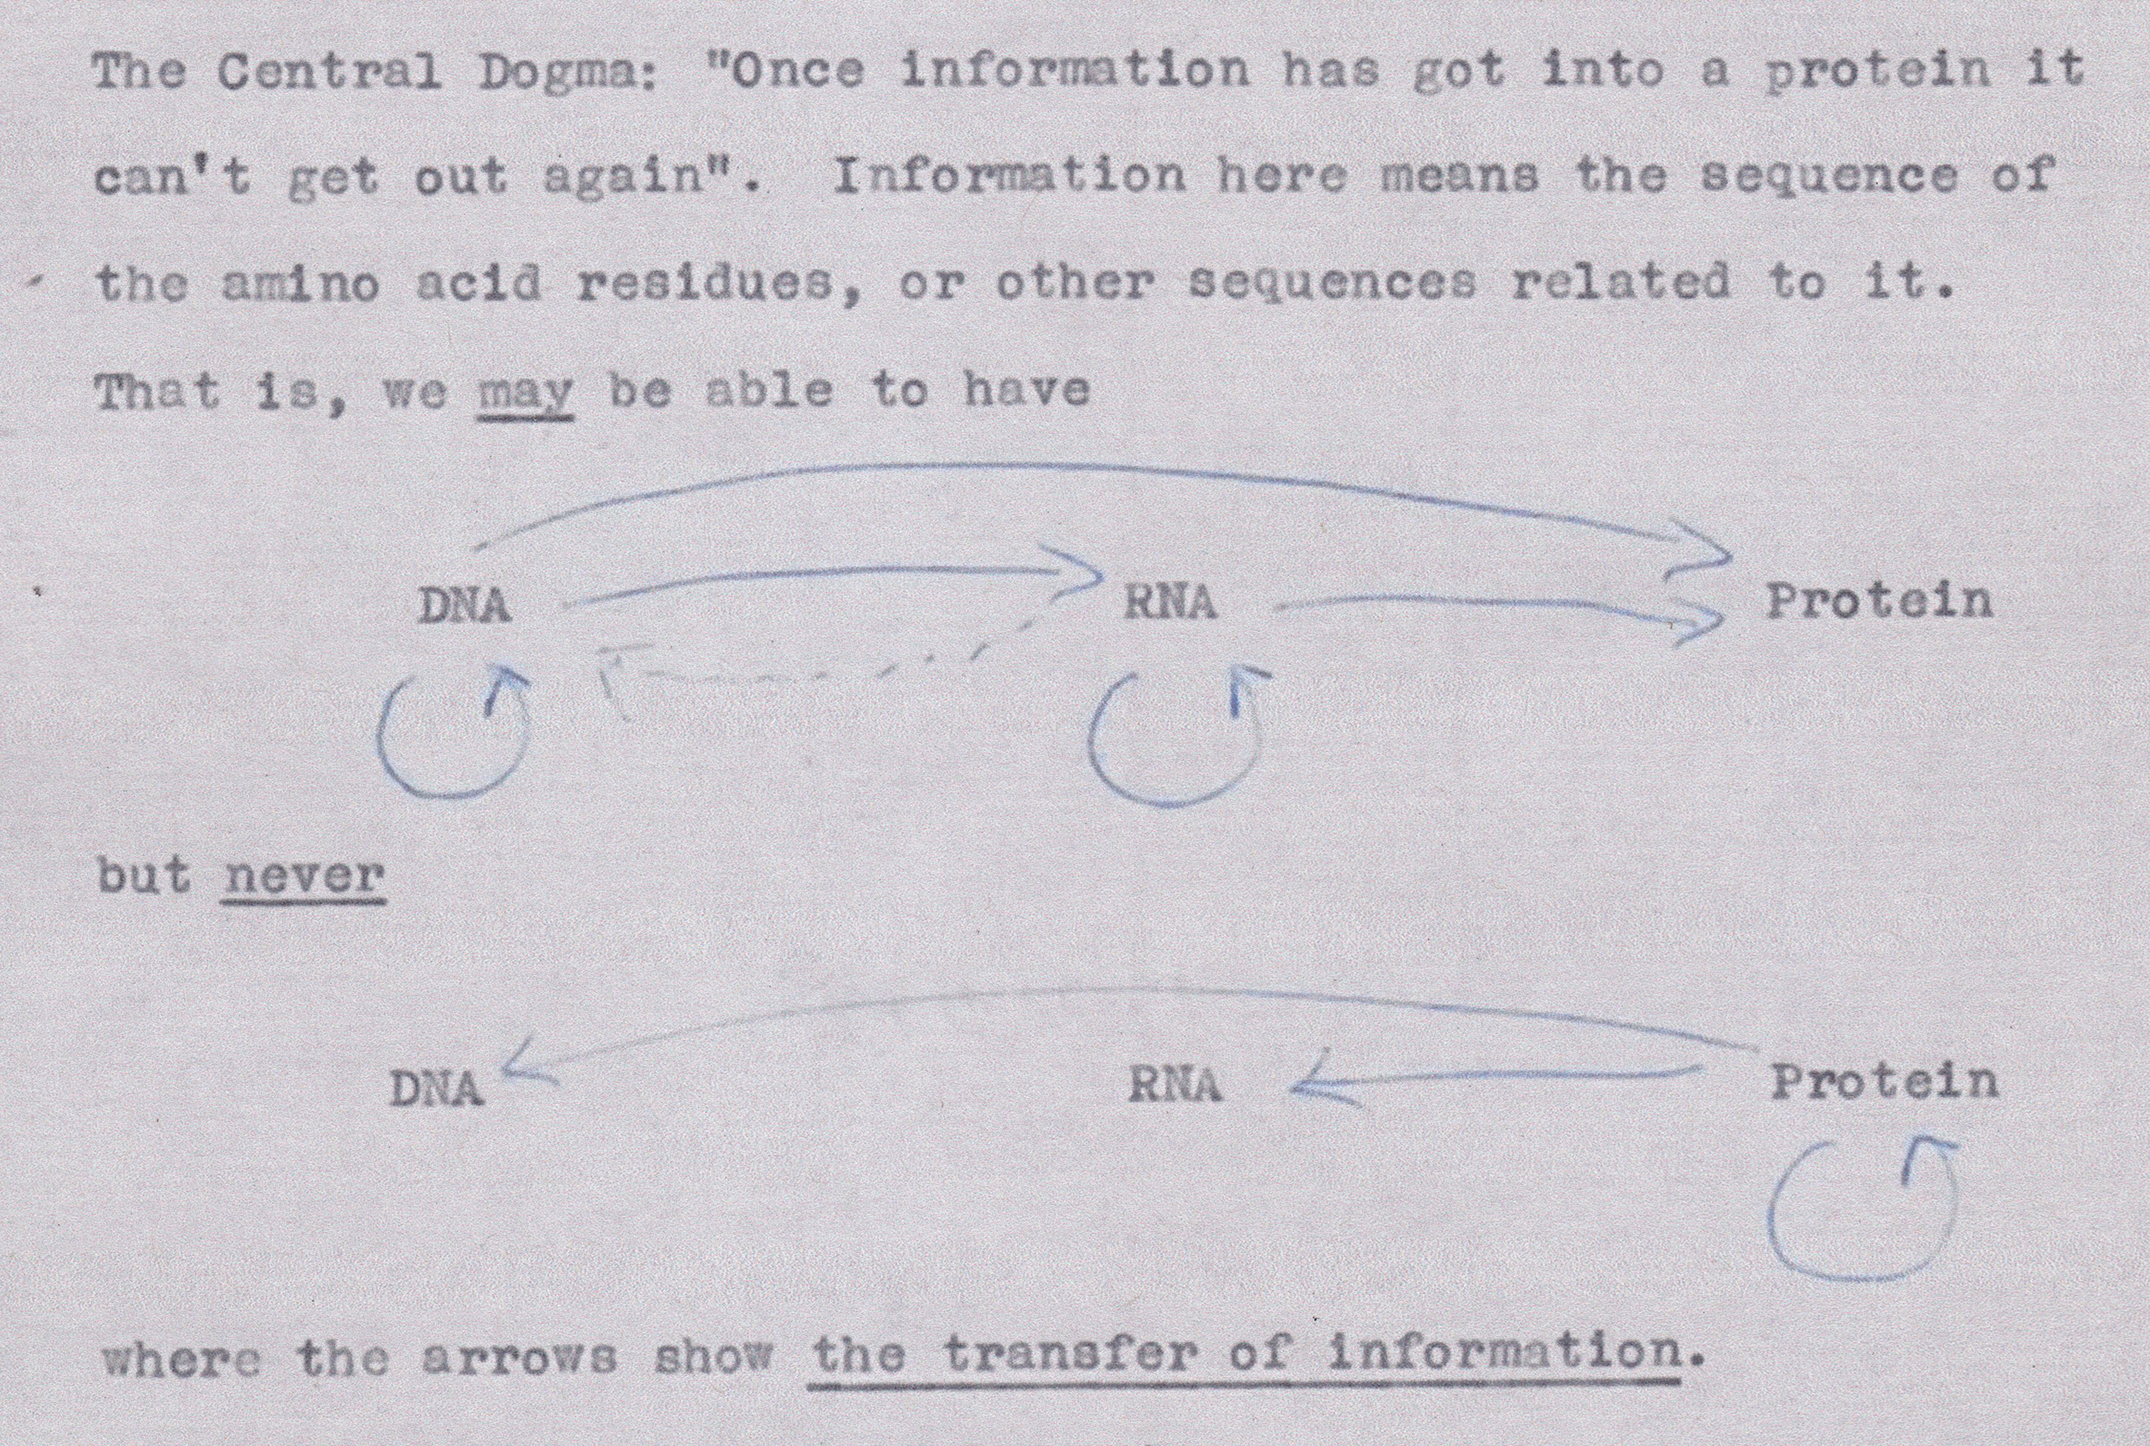
From Frances Crick, Ideas on Protein Synthesis, Unpublished Note, Wellcome Library, 1956
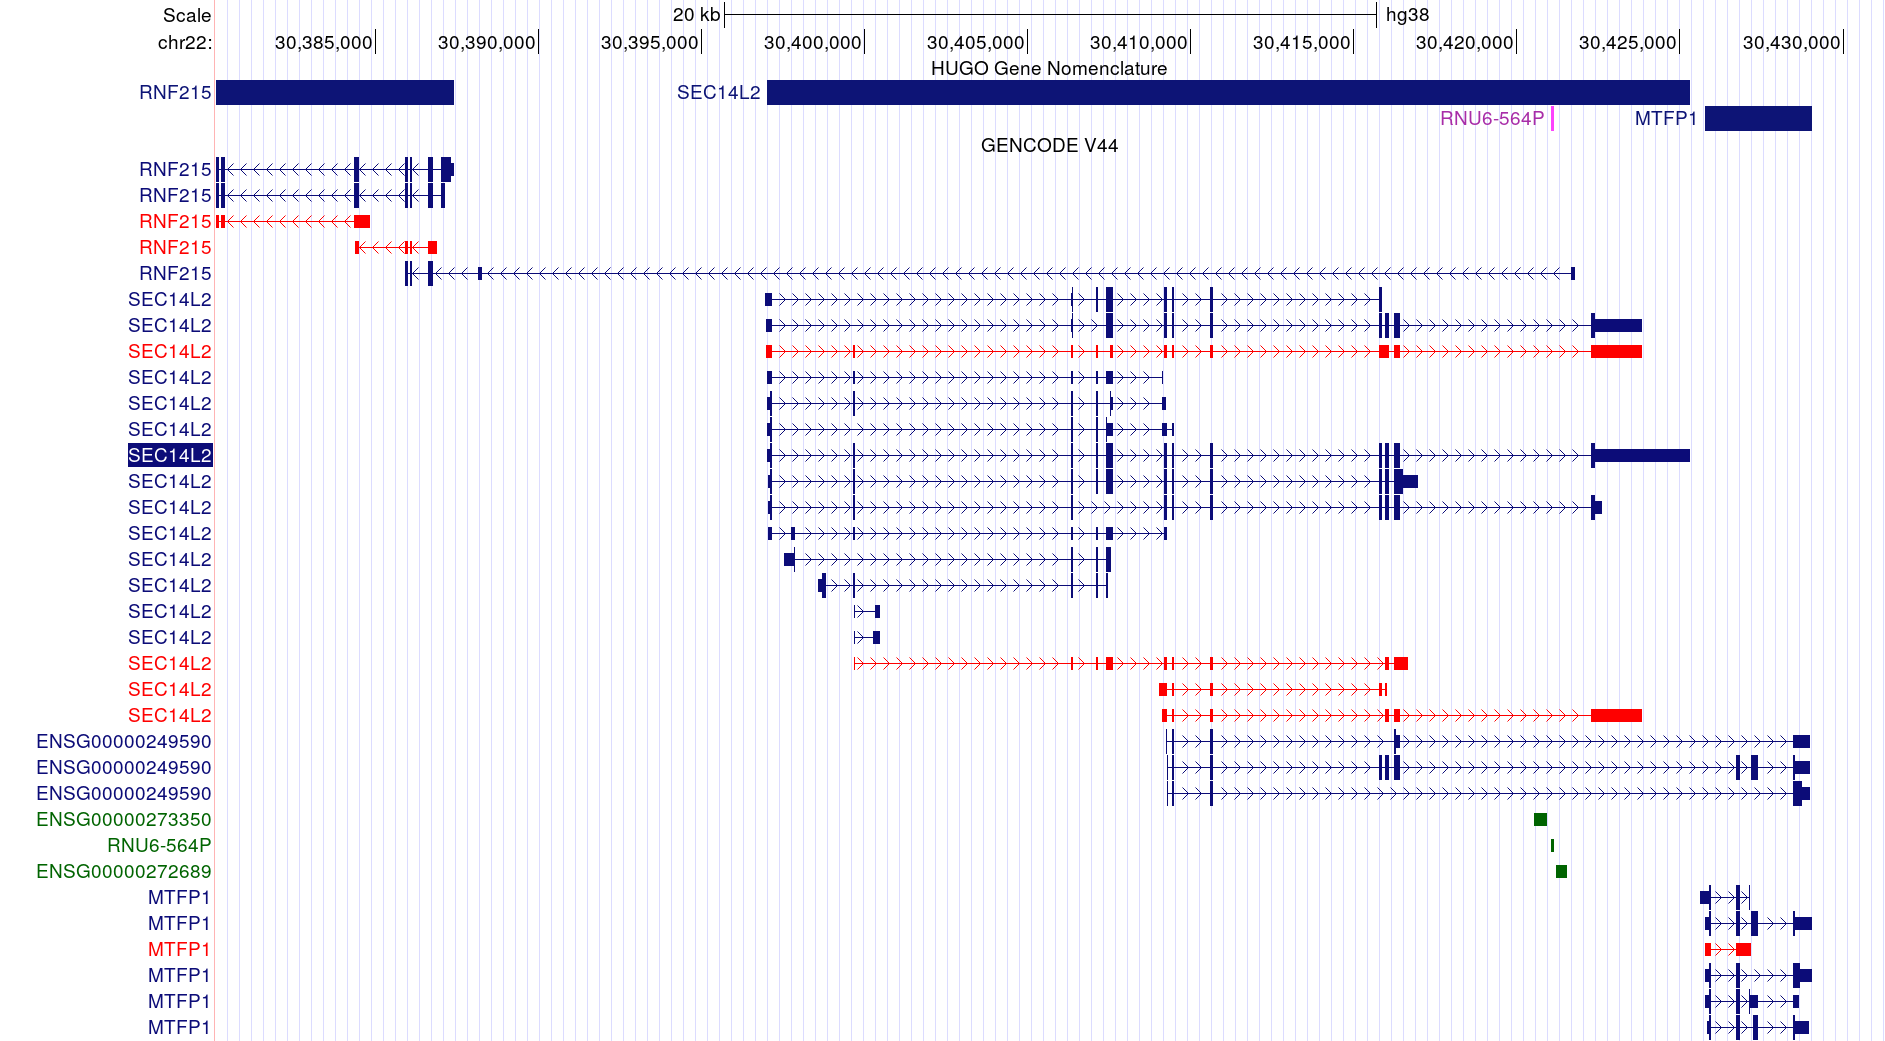
SEC14L2: A Random Example
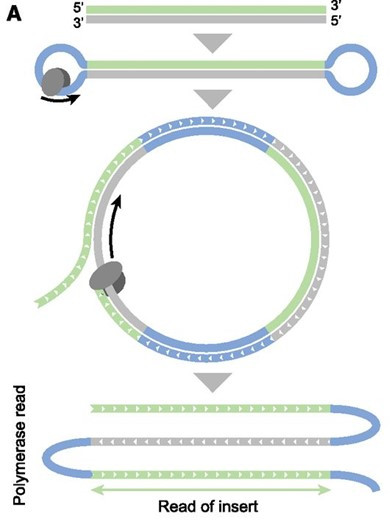
Long Reads
- Short read technology has ⇩⇩⇩ error rates
- Long reads have ⇧⇧⇧ error rates
- Reads are circularised
\(\implies\) errors corrected by repeat reads
- Great for identification of novel transcripts
\(\implies\) difficult to quantify- Creation of a custom reference transcriptome
- Challenging to refer back to functional annotations in reference
![]()