Make simple UpSet plots using ggplot2 and patchwork
simpleUpSet(
  x,
  sets = NULL,
  sort_sets = size,
  sort_intersect = list(desc(size), degree, set),
  n_intersect = 20,
  min_size = 0,
  min_degree = 1,
  max_degree = length(sets),
  set_layers = default_set_layers(),
  intersect_layers = default_intersect_layers(),
  grid_layers = default_grid_layers(),
  highlight = NULL,
  highlight_levels = NULL,
  annotations = list(),
  width = 0.75,
  height = 0.75,
  vjust_ylab = 0.8,
  stripe_colours = c("grey90", "white"),
  guides = "keep",
  top_left = NULL,
  ...,
  na.rm = TRUE
)
Arguments
- x
Input data frame
- sets
Character vector listing columns of x to plot
- sort_sets
<
data-masking> specification for set order, using variables such as size, desc(size) or NULL. Passed internally todplyr::arrange(). The only possible options aresize,desc(size)or NULL (for sets in the order passed). Can additionally accept the arguments "ascending", "descending" or "none"- sort_intersect
list of <
data-masking> specifications for intersection order. Passed internally todplyr::arrange(). The available columns aresize,degreeandset, along withhighlightif specified. Any other column names will cause an error. The default order is in descending sizes, using degree and set to break ties.- n_intersect
Maximum number of intersections to show
- min_size
Only show intersections larger than this value
- min_degree, max_degree
Only show intersections within this range
- set_layers
List of
ggplot2layers, scales and themes to define the appearance of the sets panel. Can be obtained and extended usingdefault_set_layers()- intersect_layers
List of
ggplot2layers, scales and themes to define the appearance of the intersections panel. Can be obtained and extended usingdefault_intersect_layers()- grid_layers
List of
ggplot2layers, scales & themes- highlight
dplyr::case_when()statement defining all intersections to highlight usinggeom_intersectandscale_fill/colour_intersect. Will add a column namedhighlightwhich can be called from any geom passed to the intersections barplot or matrix- highlight_levels
Given the highlight column will be coerced to a factor when setting colours etc, levels can be manually set here for finer control.
- annotations
list where each element is a list of ggplot2 layers. Each element will be added as an upper annotation panel above the intersections plot. All layer types (geom, scale, aes, stat, labs etc) can be passed with the exception of facets.
- width, height
Proportional width and height of the intersection panel
- vjust_ylab
Used to nudge the y-axis labels closer to the axis
- stripe_colours
Colours for background stripes in the lower two panels. For no stripes, set as NULL
- guides
Passed to
patchwork::plot_layout()- top_left
Optional ggplot object to show in the top left panel. Will default to an empty ggplot object
- ...
Not used
- na.rm
NAhandling
Value
Object of class 'patchwork' containing multiple ggplot panels
Details
Taking a subset of columns from a data.frame, create an UpSet plot showing all intersections as specified. Columns chosen for the sets and intersections must contain logical values or be strictly 0/1 values.
Internally, data objects will have the variables set and intersect which
can be referred to when passing custom aes() mappings to various layers.
If specifying highlights, the column highlight will also be added as a
column to the data.frame containing intersections data, following the
case_when output provided as the argument.
Scales can be passed to the intersections and grid panels, taking this
structure into account.
Any additional layers passed using annotations() will have layers added
after an initial, internal call to ggplot(data, aes(x = intersect)).
Additional columns can be used where appropriate for creating boxplots etc.
A list of ggplot2 layers, scales, guides and themes is expected in each of
the set_layers, intersect_layers or grid_layers arguments, with
defaults generated by calls to default_set_layers(),
default_intersect_layers() or default_grid_layers().
These can be used as templates to full customisation by creating a custom
list object, or modified directly using the ellipsis
Examples
## Use a modified version of the movies data provided with the package UpSetR
library(tidyverse)
#> ── Attaching core tidyverse packages ──────────────────────── tidyverse 2.0.0 ──
#> ✔ dplyr 1.1.4 ✔ readr 2.1.6
#> ✔ forcats 1.0.1 ✔ stringr 1.6.0
#> ✔ lubridate 1.9.4 ✔ tibble 3.3.0
#> ✔ purrr 1.2.0 ✔ tidyr 1.3.1
#> ── Conflicts ────────────────────────────────────────── tidyverse_conflicts() ──
#> ✖ dplyr::filter() masks stats::filter()
#> ✖ dplyr::lag() masks stats::lag()
#> ℹ Use the conflicted package (<http://conflicted.r-lib.org/>) to force all conflicts to become errors
theme_set(theme_bw())
sets <- c("Action", "Comedy", "Drama", "Thriller", "Romance")
movies <- system.file("extdata", "movies.tsv.gz", package = "SimpleUpset") %>%
read_tsv() %>%
mutate(
Decade = fct_inorder(Decade) %>% fct_rev()
)
#> Rows: 3883 Columns: 10
#> ── Column specification ────────────────────────────────────────────────────────
#> Delimiter: "\t"
#> chr (2): Name, Decade
#> dbl (8): ReleaseDate, Action, Comedy, Drama, Thriller, Romance, AvgRating, W...
#>
#> ℹ Use `spec()` to retrieve the full column specification for this data.
#> ℹ Specify the column types or set `show_col_types = FALSE` to quiet this message.
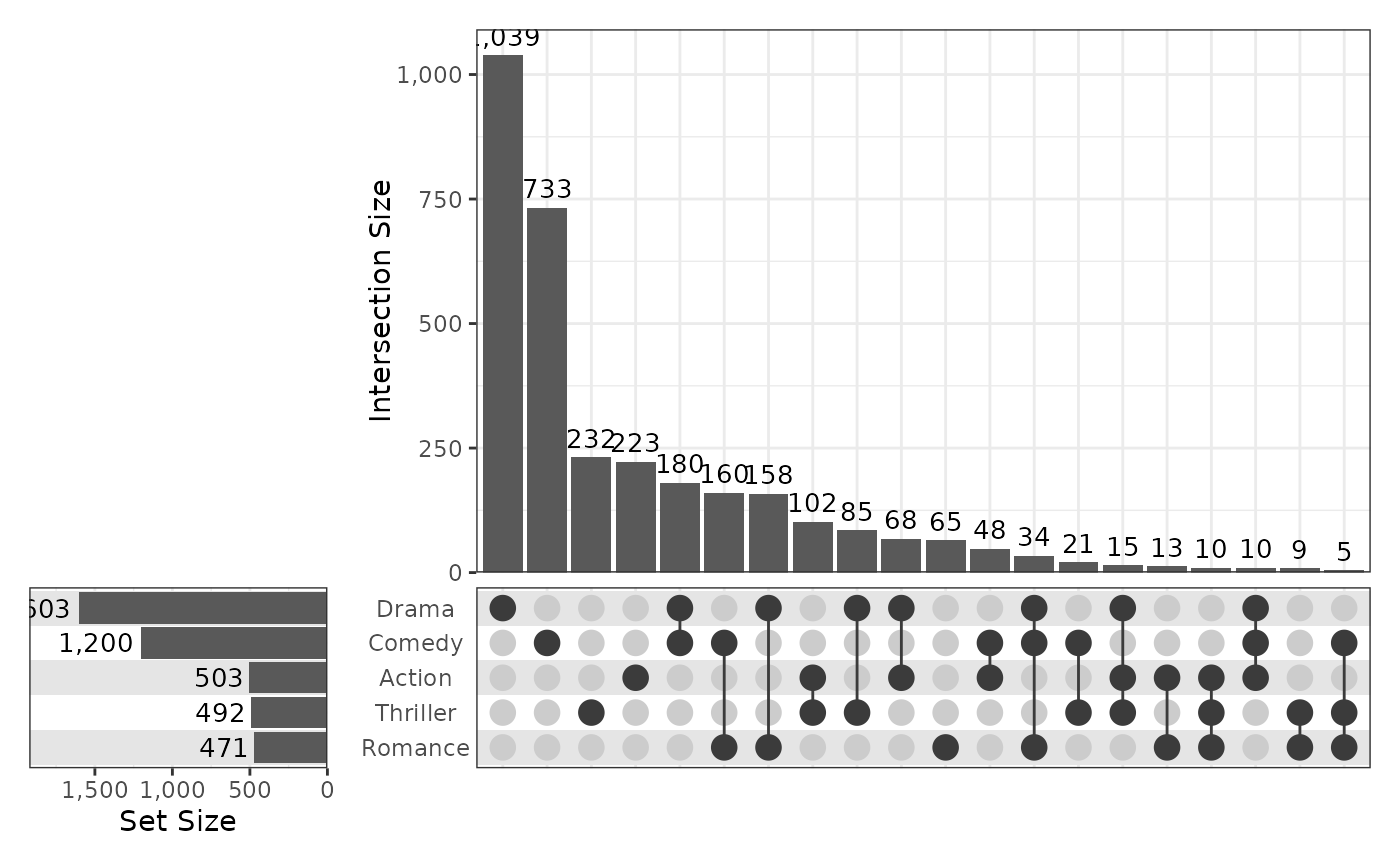
simpleUpSet(movies, sets)
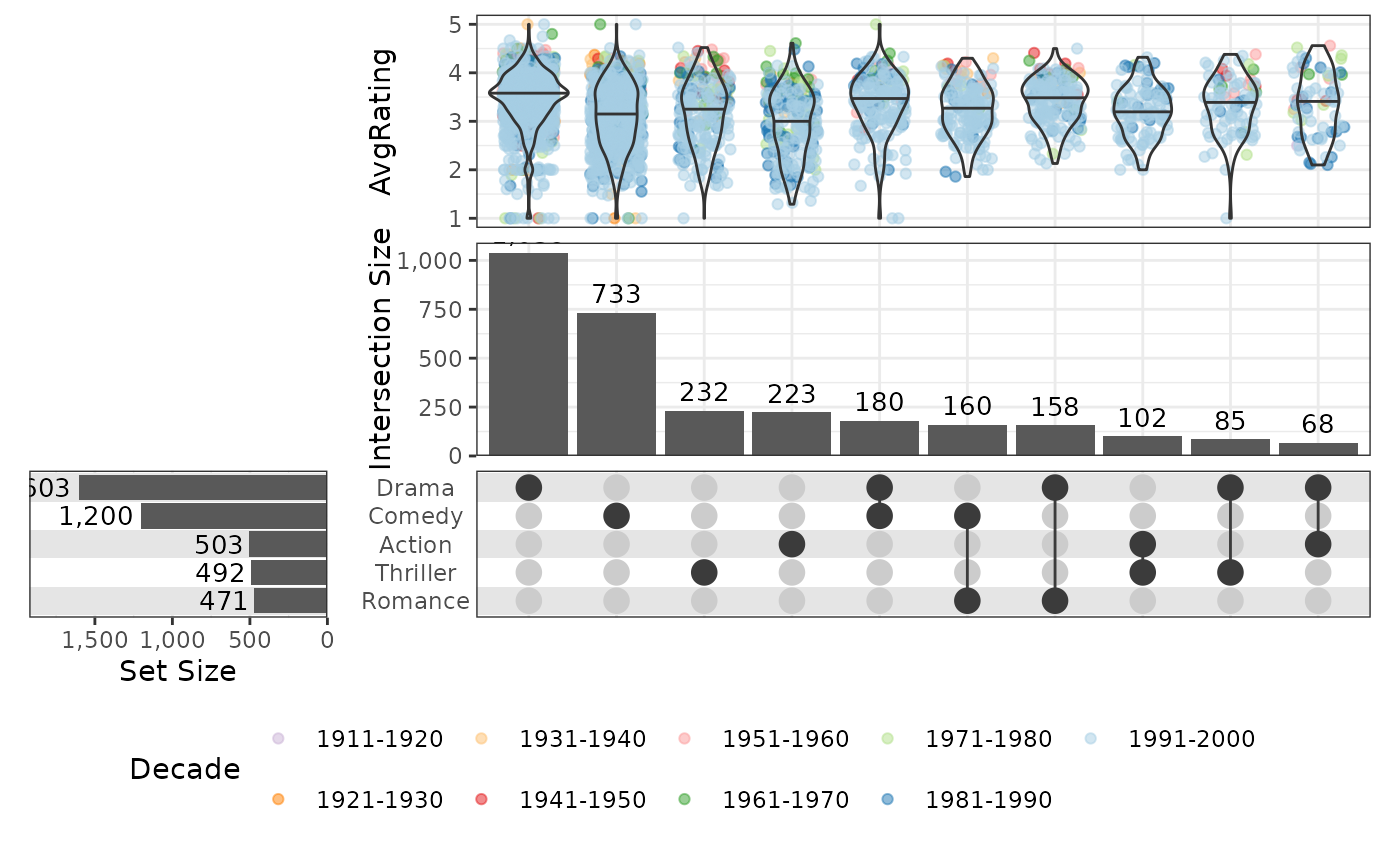
 ## Add a detailed upper plot
simpleUpSet(
movies, sets, n_intersect = 10,
annotations = list(
list(
aes(y = AvgRating),
geom_jitter(aes(colour = Decade), height = 0, width = 0.3, alpha = 0.5),
geom_violin(fill = NA, quantiles = 0.5, quantile.linetype = 1),
scale_colour_brewer(palette = "Paired"),
guides(colour = guide_legend(nrow = 2, reverse = TRUE))
)
), guides = "collect"
) &
theme(legend.position = "bottom")
## Add a detailed upper plot
simpleUpSet(
movies, sets, n_intersect = 10,
annotations = list(
list(
aes(y = AvgRating),
geom_jitter(aes(colour = Decade), height = 0, width = 0.3, alpha = 0.5),
geom_violin(fill = NA, quantiles = 0.5, quantile.linetype = 1),
scale_colour_brewer(palette = "Paired"),
guides(colour = guide_legend(nrow = 2, reverse = TRUE))
)
), guides = "collect"
) &
theme(legend.position = "bottom")
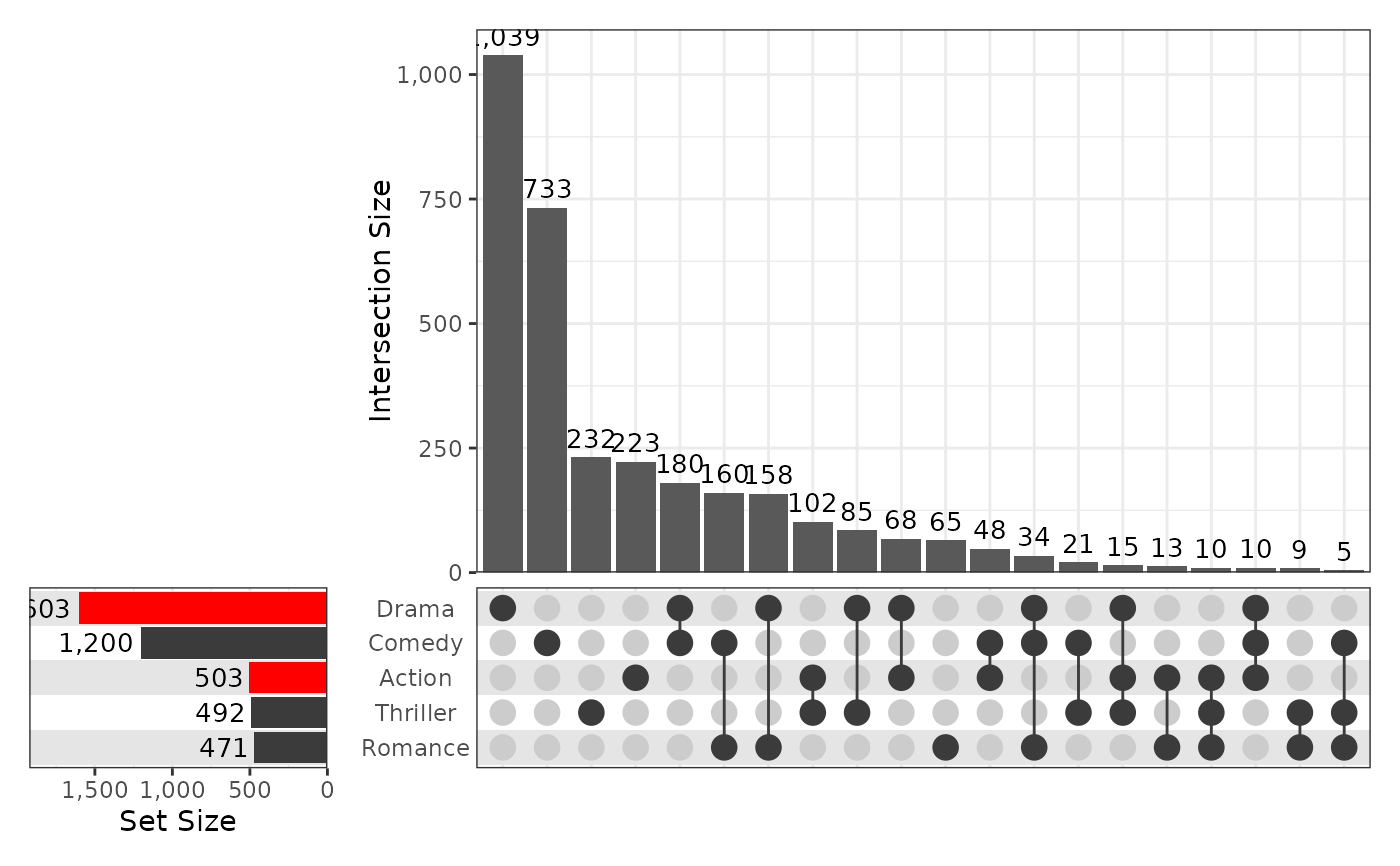
 ## Modify set colours
set_cols <- c(
Action = "red", Comedy = "grey23", Drama = "red",
Romance = "grey23", Thriller = "grey23"
)
simpleUpSet(
movies, sets,
set_layers = default_set_layers(
fill = "set", scale_fill_manual(values = set_cols), guides(fill = guide_none())
)
)
## Modify set colours
set_cols <- c(
Action = "red", Comedy = "grey23", Drama = "red",
Romance = "grey23", Thriller = "grey23"
)
simpleUpSet(
movies, sets,
set_layers = default_set_layers(
fill = "set", scale_fill_manual(values = set_cols), guides(fill = guide_none())
)
)